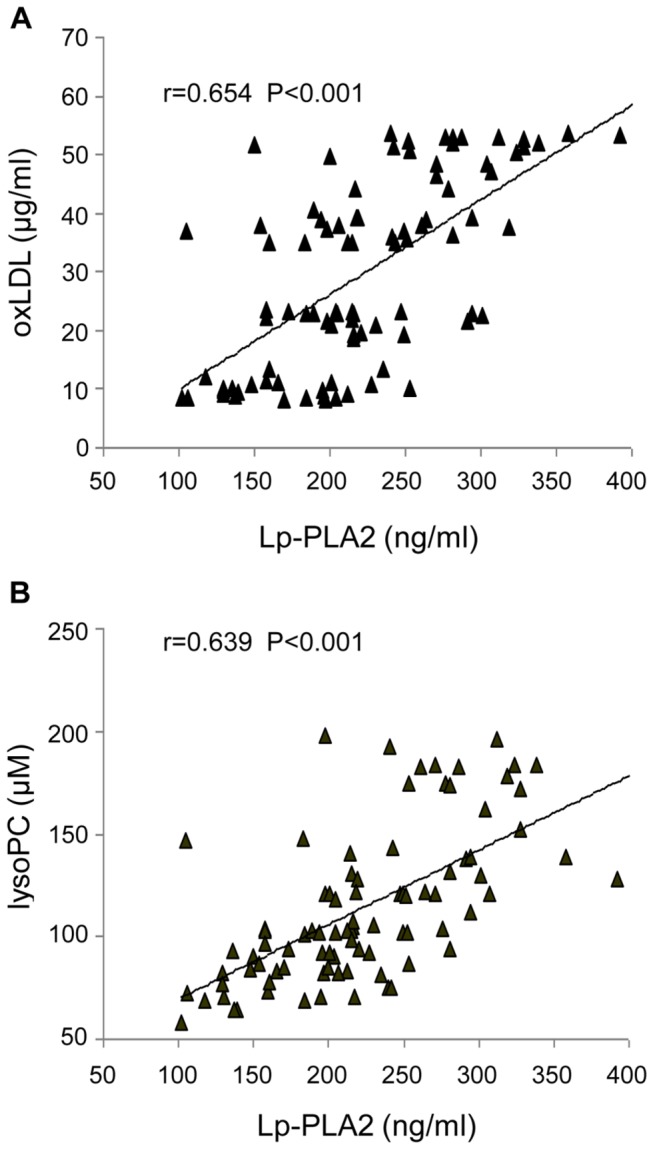
Figure 1. Correlation between plasma lipoprotein-associated phospholipase A2 (Lp-PLA2) and oxidized LDL (oxLDL) and between plasma LpPLA2 and lysophosphatidylcholine (lysoPC).

(A) Correlation between plasma Lp-PLA2 and oxLDL and (B) correlation between plasma Lp-PLA2 and lysoPC concentrations in the whole population of subjects studied.
