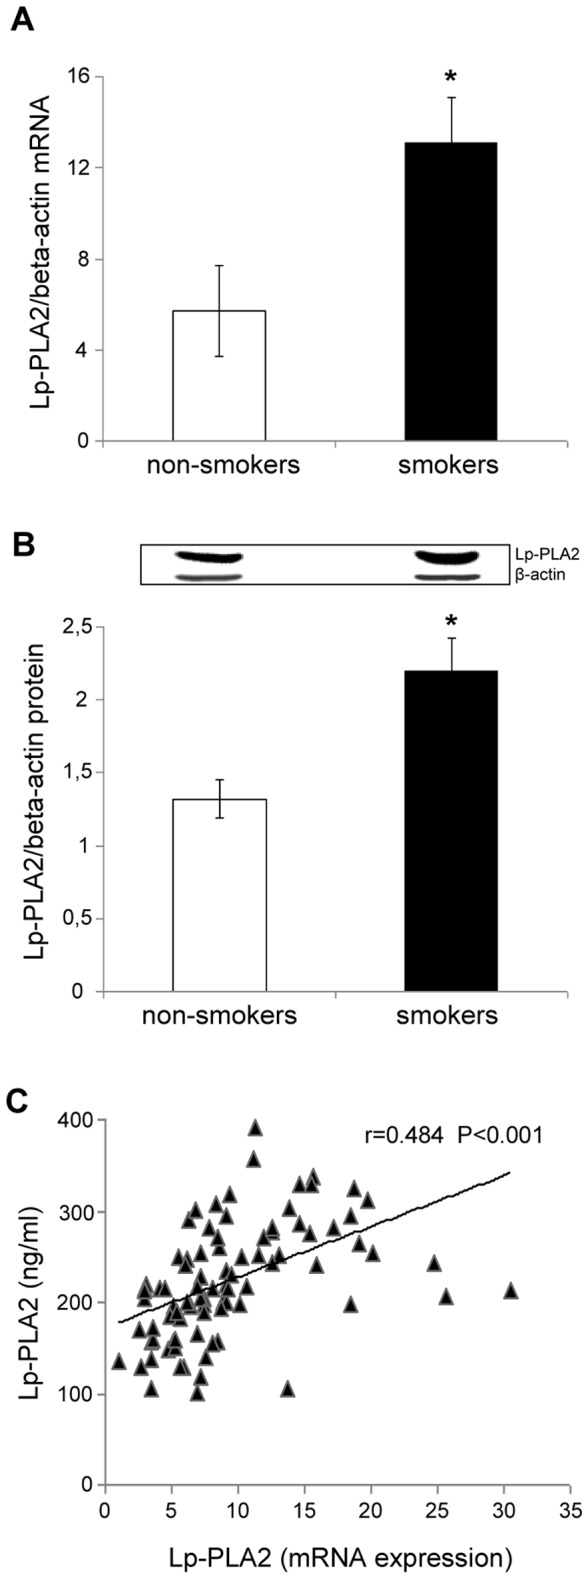
Figure 2. Lipoprotein-associated phospholipase A2 (Lp-PLA2) mRNA and protein expression in peripheral blood mononuclear cells (PBMC) of non-smokers and smokers and correlation between Lp-PLA2 expression in PBMC and plasma Lp-PLA2.

(A) mRNA was analyzed by quantitative Real-Time PCR. Normalized gene expression levels were given as the ratio between the mean value for the Lp-PLA2 gene and that for beta-actin in each sample. Data are presented as mean+SD. *P<0.001 versus non-smokers. (B) Representative Western blot analysis for Lp-PLA2 and the average quantification obtained by densitometric analysis of all the samples (20 subjects per group, randomly selected). (C) Correlation between Lp-PLA2 mRNA expression in PBMC and plasma concentrations of Lp-PLA2 in the whole population of subjects studied.
