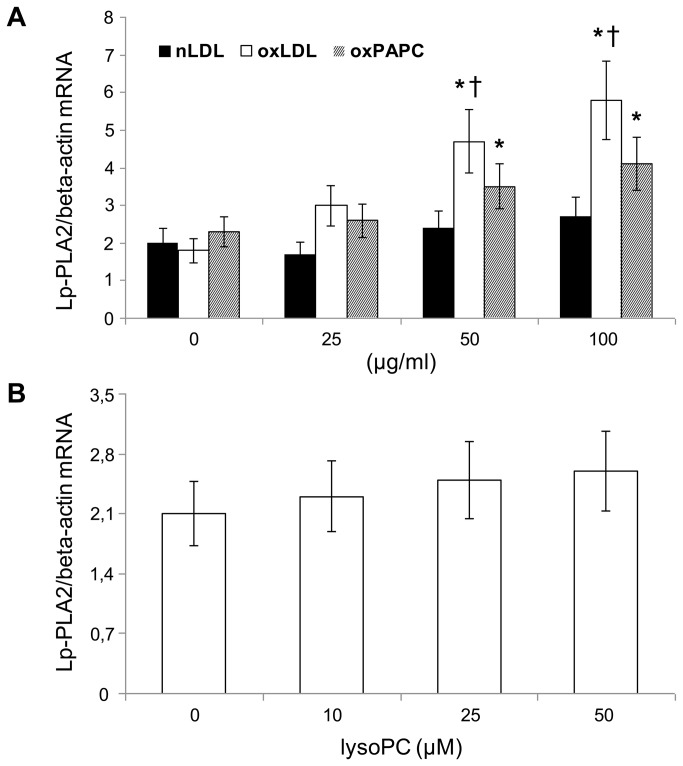
Figure 4. Dose-response effect of native LDL (nLDL), oxidized LDL (oxLDL), oxidized phospholipids (oxPAPC), and of lysophosphatidylcholine (lysoPC) on mRNA expression of Lp-PLA2.
(A) Dose-response effect of nLDL, oxLDL and oxPAPC (0-100 µg/ml) and (B) dose-response effect of lysoPC (0-50 µM) on mRNA expression of Lp-PLA2 after incubation with PBMC for 6 h. Normalized gene expression levels were given as the ratio between the mean value for Lp-PLA2 gene and that for the beta-actin in each sample. Data represent the mean±SD of measurements performed in triplicate in four different occasions. *P<0.01 versus basal, †P<0.01 versus oxPAPC.

