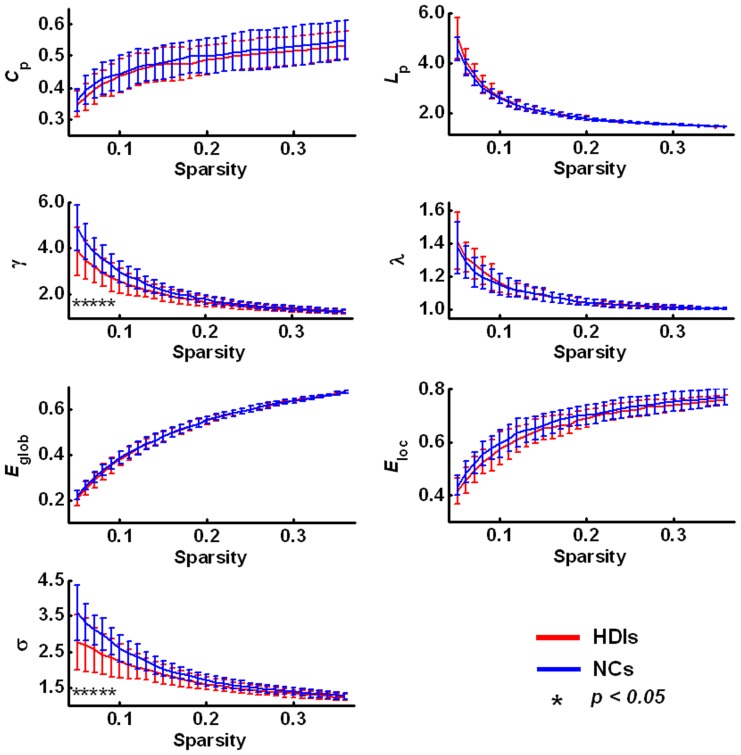
Figure 1. Global parameters of the brain functional networks for the heroin-dependent individuals (HDIs) and the normal controls (NCs) changing with the sparsity threshold.
The error bar represents the standard deviation of a parameter at a given sparsity across all subjects. The symbol (*) means that significant between-group difference in the given parameter was detected (p<0.05). Except for the sparsity range of 0.05≤sparsity≤0.09, no statistically significant between-group differences were detected for other values of sparsity.  , clustering coefficient;
  , characteristic path length;
  , normalized clustering coefficient;
  , normalized shortest path length;
  , small-worldness;
  , global efficiency;
  , local efficiency.

