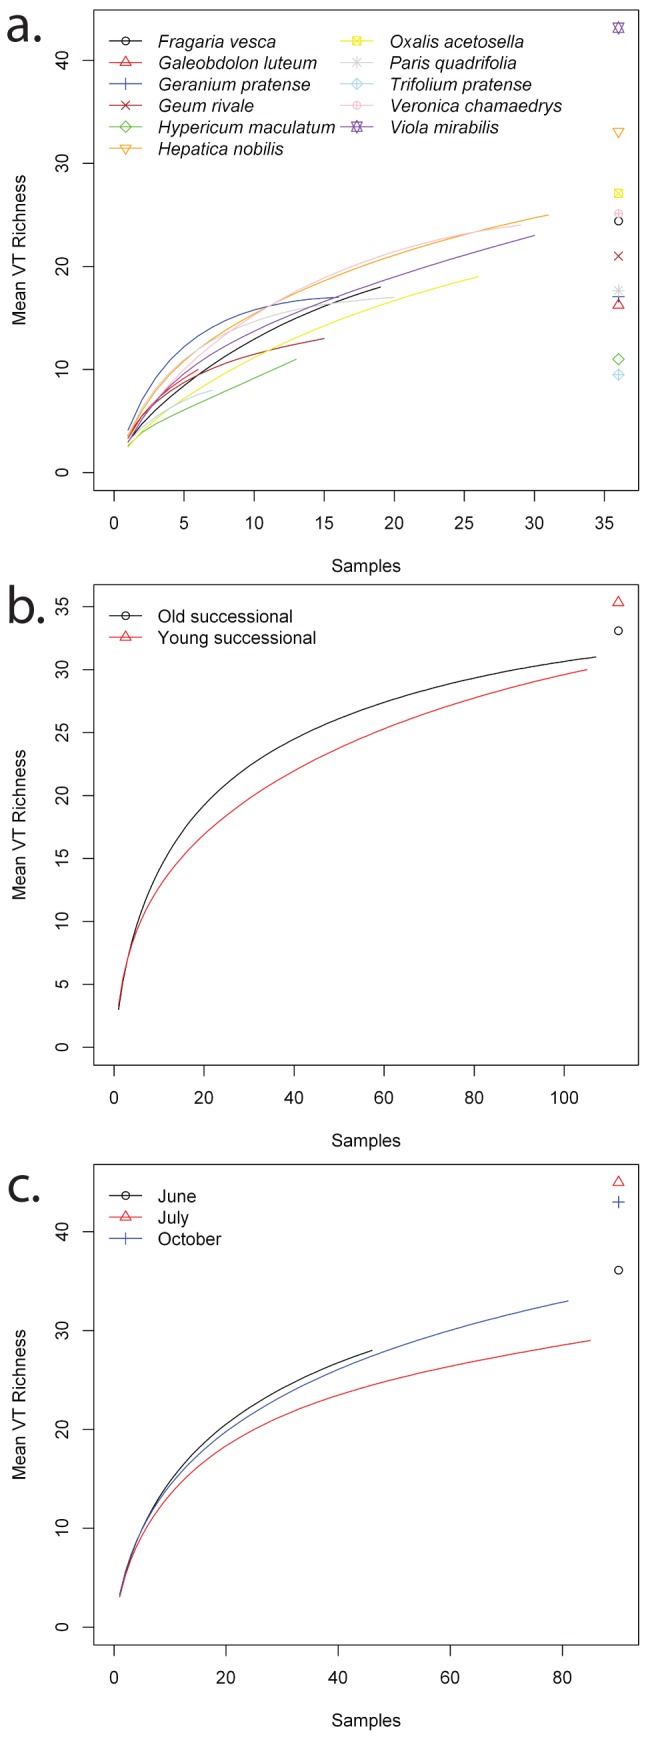
Figure 2. Rarefaction curves for each of the a) plant species, b) successional stages, and c) sampling times.

Chao estimates of total richness are included on the right side of each graph.

Chao estimates of total richness are included on the right side of each graph.