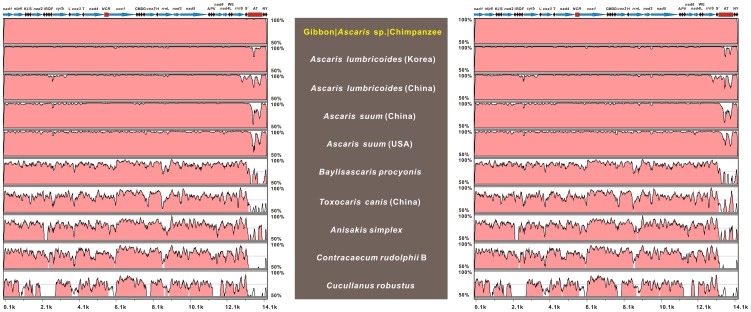
Figure 4. Percent identity sketch for comparisons of the 11 Ascaridida mt genomes with mVISTA.
mtDNAs of Ascaris isolates from chimpanzee (left) and gibbon (right) were separately used as reference sequences for genome-wide comparisons carried out using the mVISTA program. The upper line denotes gene order (transcriptional direction indicated by arrows). Horizontal pink bars represent sequence similarity of the aligned regions, indicating percentage identity between 50–100% for a 100-bp moving window (shown on the Y-axis). The X-axis represents the coordinate in the mt genome. Cyan arrows (PCGs and rRNAs), black bullets (tRNAs), and red rectangles (NCR, non-coding region; AT, AT-rich region) on the upper line represent the genes or regions indicated in parentheses.

