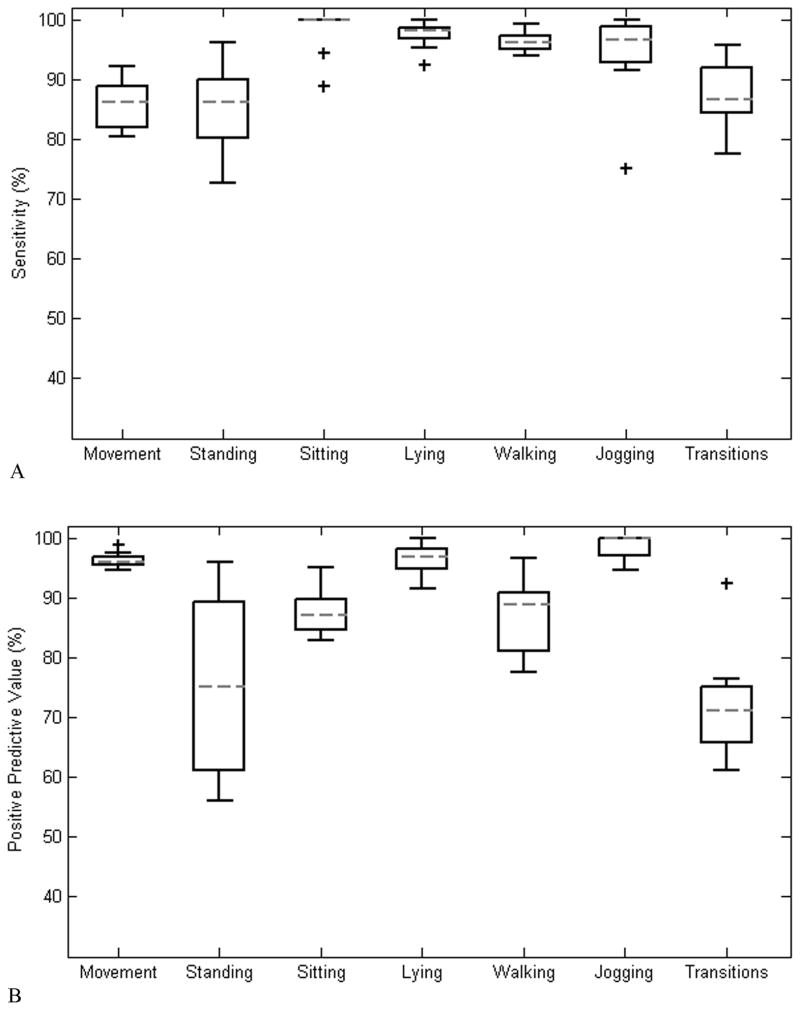
Figure 3.
Sensitivity (A) and positive predictive value (B) when identifying static orientations and dynamic movements with accelerometer data compared to video identification among all subjects. The central line represents the median, the edges of the box are the 25th and 75th percentiles, and the whiskers extend to ± 1.5 of the interquartile range. Outliers beyond this range are labeled as +. For the PPV of jogging, the median value is equal to 100%.

