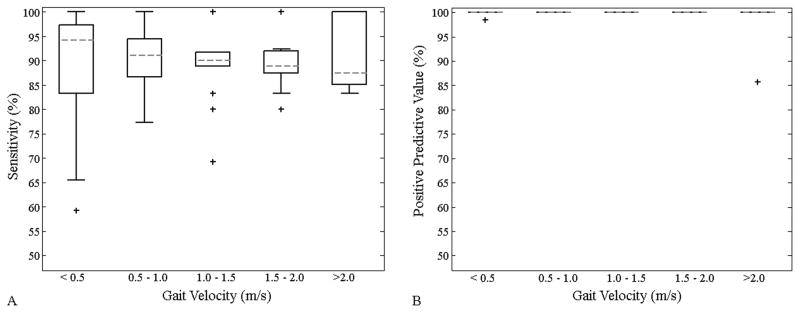
Figure 5.

Boxplot of activity detection when walking at a range of gait velocities. The median sensitivity (A) was greater than 84% and the median PPV (B) 100% at all velocities. The central line represents the median, the edges of the box are the 25th and 75th percentiles, and the whiskers extend to ± 1.5 of the interquartile range. Outliers beyond this range are labeled as +.
