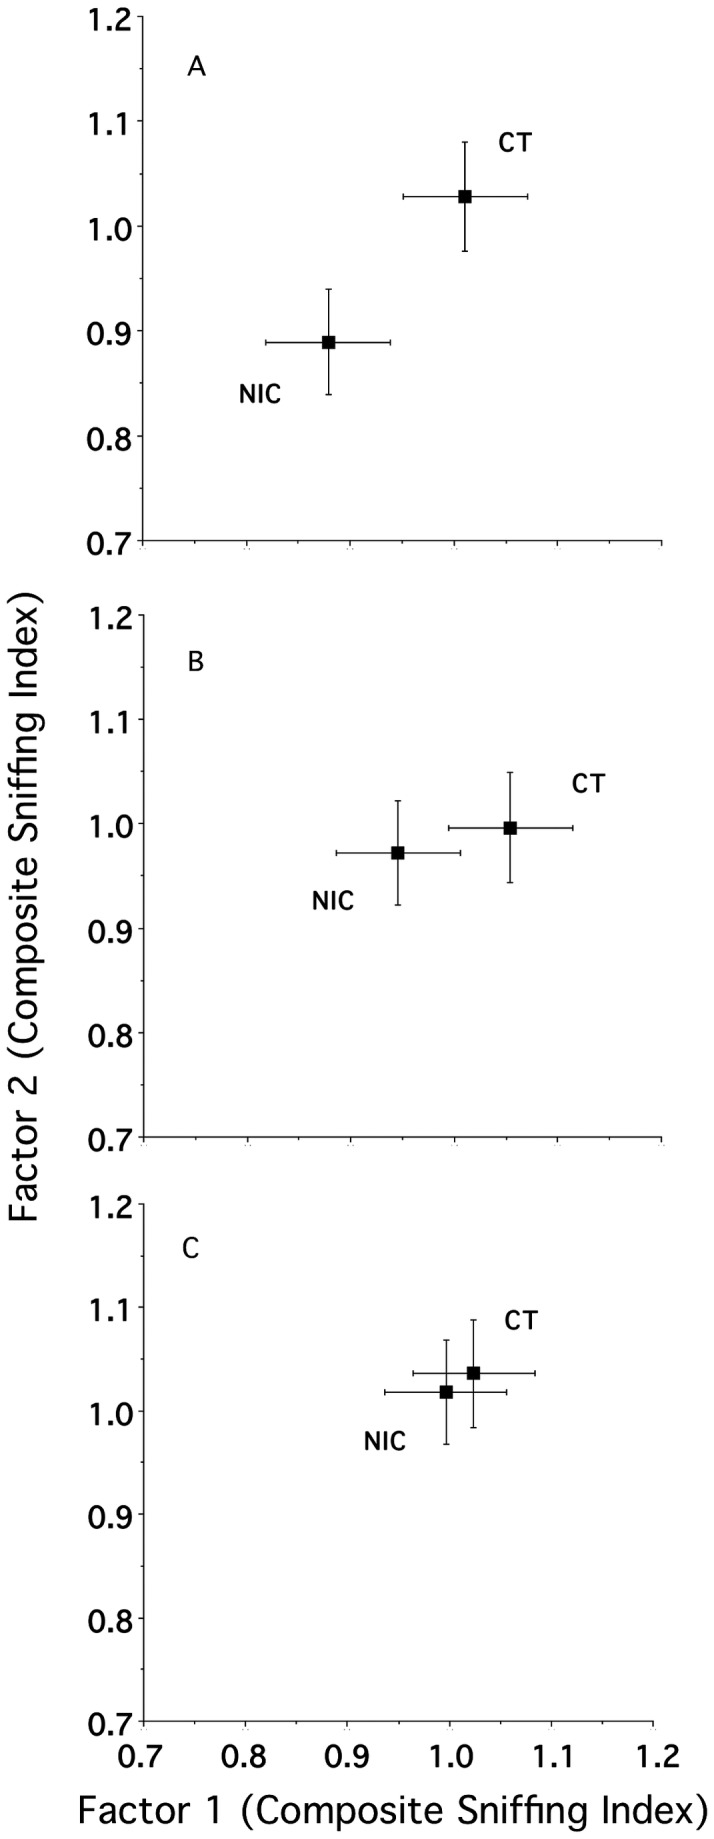
Figure 2. Composite sniffing indices for P17 (Panel A), P35 (Panel B) and P90 (Panel C) animals.

The values illustrate the mean (± 2-dimensional s.e.m.) relative position of the nicotine versus combined controls in a stimulus-induced behavioral response space.
