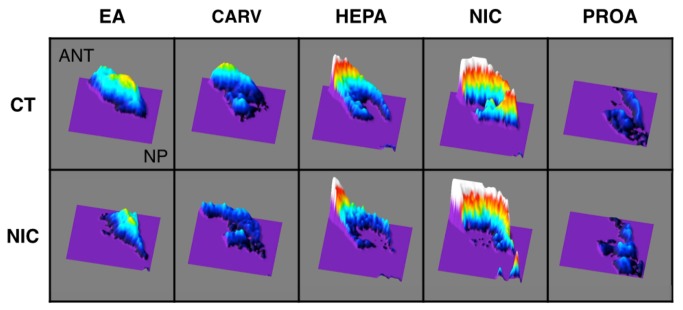
Figure 5. Average surface plots of the septal olfactory epithelium for P17 nicotine and combined controls maternal treatment group in response to ethylacetoacetate (EA), carvone (CA), heptanal (HEP), nicotine (NIC), and propyl acetate (PROA).
The magnitude of the z-axis represents a shift in response for a specific stimulus at a specific pixel of the camera array compared with the standard for that same pixel. (N.B.: the entire array of responses has been equilibrated to a value of 100%). The point of reference of the response panels is: ANT = anterior and dorsal septum; NP = nasopharynx and ventral. NIC = fetal-nicotine-exposed rats; CT = combined VC and NP controls.

