
Figure 2.
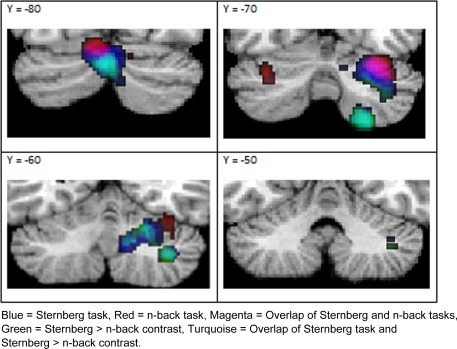
Overlay map of ALE peak activation results from individual task analyses of Sternberg and n‐back only; and direct comparison of Sternberg versus n‐back tasks. The contrast of n‐back>Sternberg did not yield any significant positive clusters.