
Figure 2. Diet effects on metabolic pathways.
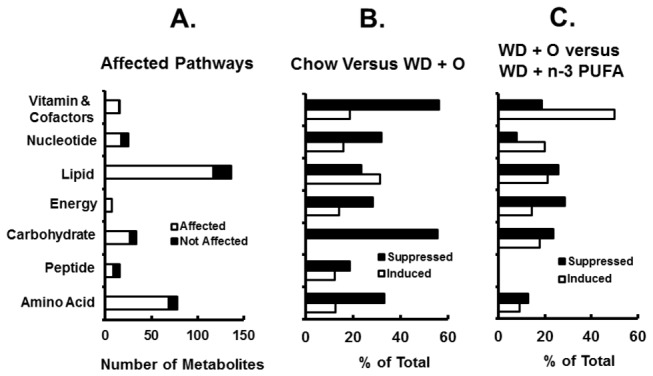
Panel A: Number of metabolites significantly changed in each pathway by all diets. Panel B: Percent of metabolites in each pathway that were induced or suppressed in WD + O fed mice relative to chow fed mice. Panel C: Percent of metabolites in each pathway that were induced or suppressed in all WD + C20-22 n-3 PUFA fed mice relative to WD + O fed mice.