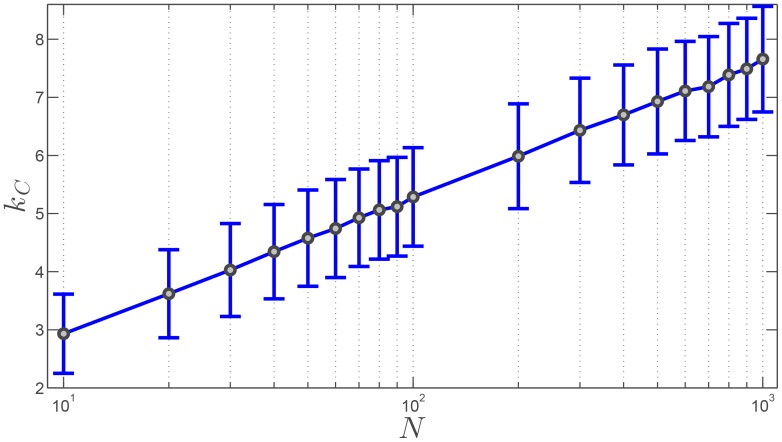
Figure 3. Critical value of the number of topological neighbors,  , for which the connectedness of the network is guaranteed, as a function of the swarm size
  , with
  ranging from 10 to 1000.
Grey dots represent the average value of  obtained from a statistical analysis comprising 1000 randomly generated k-nearest digraphs. The errorbars represent the associated standard deviations.

