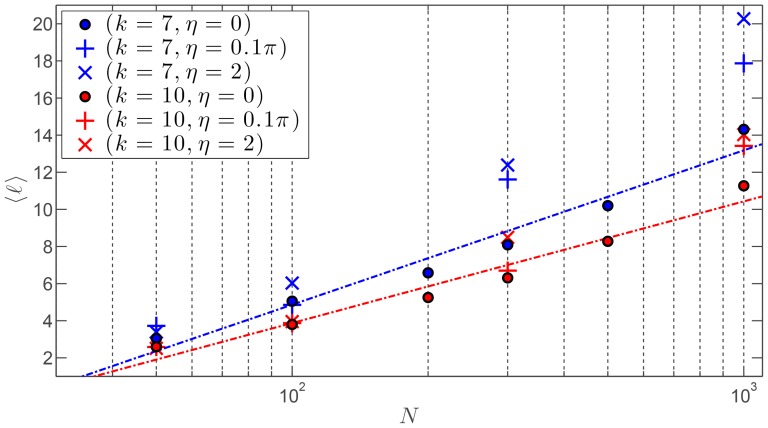
Figure 4. Average shortest connecting path vs. number of agents for the SSN.
A log scale is used for the number of agents  . Two possible values of the outdegree are considered:
  and 10. Three values of the noise level
  are considered: noiseless (
 ), moderate (
 rad), high (
 rad). The linear fitting in log scale is only shown for the noiseless case using dash-dotted lines.

