
Figure 7. Indegree distribution  of agents in the SSN for several simulations of the swarming model with
 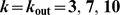 and different number of agents.

 and 1000; Top: linear scales with the exact values corresponding to the Poisson distributions for
  and 10 shown using thin dash-dotted lines, and Bottom: logarithmic scales. The average indegrees
  are
are  and their standard deviations
  are approximately
  , for
, for  respectively. The noise level is fixed and set to
  .
.