Figure 5.
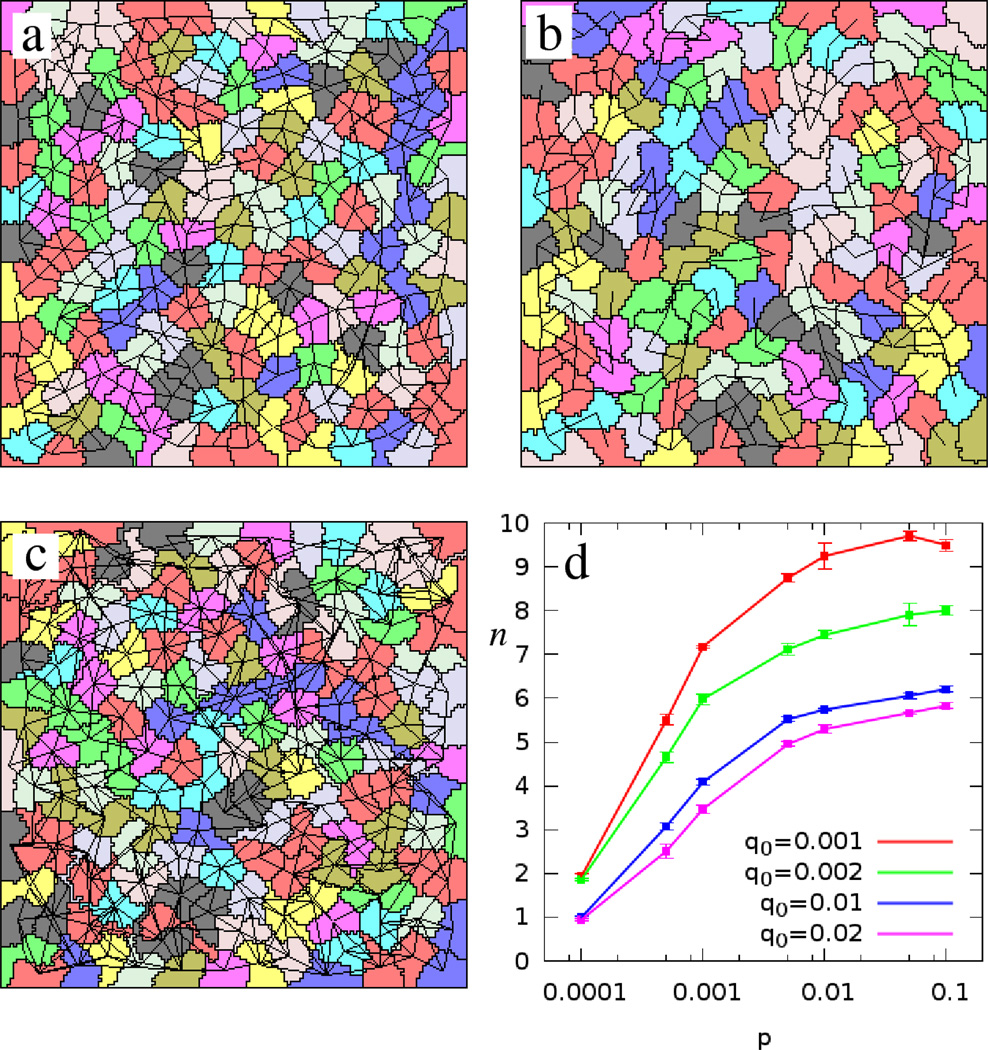
Monolayer simulations with various bond dynamics parameters. Panel a shows a typical cell configuration using our standard set of parameter values: p = 10−3, q0 = 10−2 and k = 0.2. Decreasing p to p = 10−4 results in sparse connectivity (b). If the connections are maintained longer, such as in the choice of q0 = 10−3, the number of links between non adjacent cells increases (c). The average number of connections per cell (n) saturates with increasing p (d). Red, green, blue and violet colors indicate q0 values of 0.001, 0.002, 0.01 and 0.02, respectively.

