Figure 6.
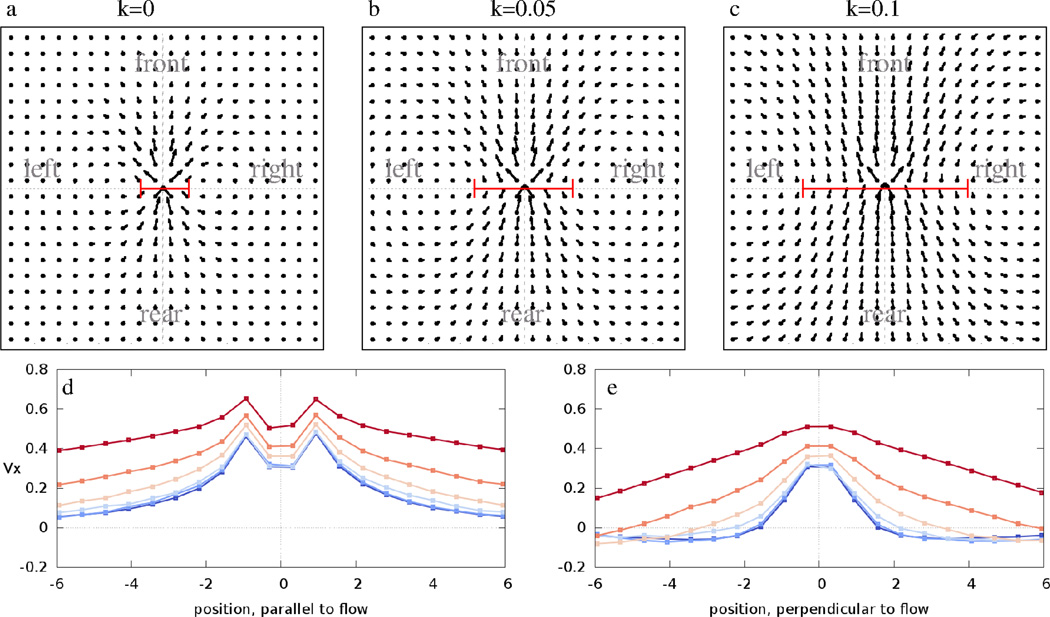
Average flow fields V⃗ (x⃗) obtained from model simulations performed with p = 10−3, q0 = 10−2 and various weights, k, assigned to mechanical guidance. The grid spacing corresponds to r0/2, half of the target cell radius. In the absence of cell-cell contacts (k = 0, panel a) we recover the highly anisotropic, narrow streams reported previously for self-propelled CPM simulations and endothelial cultures [6]. As k increases, the width of the co-moving streams increases, as indicated by bars on panels a, b, and c. The average V⃗x values along the front-rear and left-right axis are plotted for various values of k in panels d and e, respectively. Distance is given in units of r0. Blue to red colors indicate k = 0, 0.01, 0.02, 0.05, 0.1 and 0.2, respectively. The red lines in panels a–c indicate stream widths, as obtained by an exponential fit of the velocity profiles shown in panel e. See also Movies 5–9.

