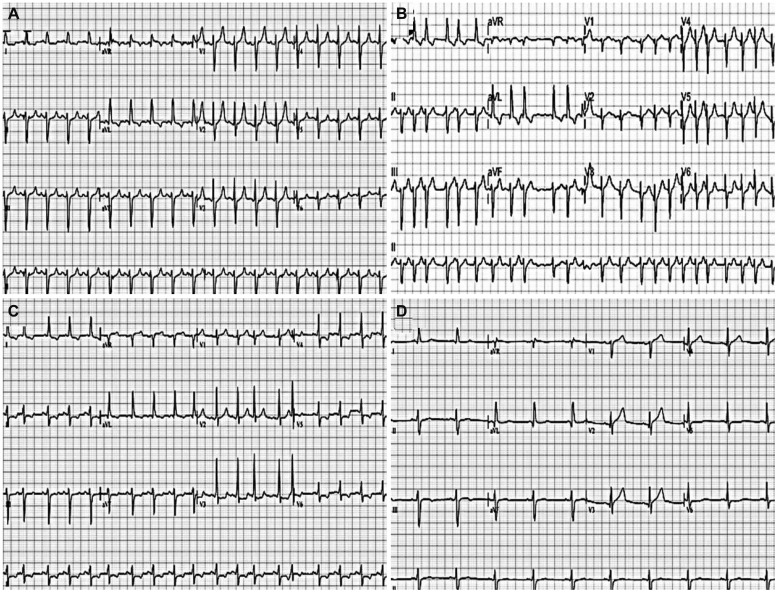
Fig. 1.
Serial electrocardiograms of the patient. A: electrocardiogram (ECG) at initial presentation. B: ECG showing atrial fibrillation with fast ventricular response. C: ECG showing dynamic ST-segment depressions in multiple leads. D: ECG after percutaneous coronary intervention showing sinus rhythm without ST-segment changes.

