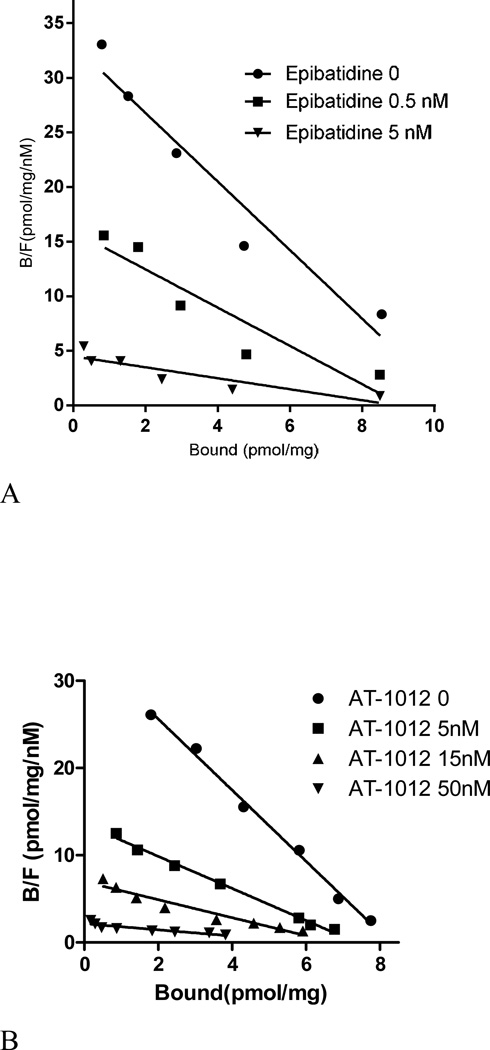
Figure 4.
(A) Inhibition of [125I]AT-1012 saturation with epibatidine. [125I]AT-1012 saturation experiments were conducted in the presence of 0, 0.5 nM and 1.5 nM epibatidine to examine the competitive or non-competitive nature of binding. Non-linear regression analysis of the saturation data resulted in Kd values of 0.22 nM, 0.34 nM and 1.04 nM; and Bmax values of 7.92, 6.36, and 5.58 pmol/mg, for binding in the presence of 0, 0.5 nM and 1.5 nM epibatidine respectively. Nonspecific binding was determined using 0.1 µM of unlabeled epibatidine. (B). Inhibition of [3H]epibatidine saturation with AT-1012. [3H]Epibatidine saturation experiments were conducted in the presence of 0, 5 nM, 15 nM, and 50 nM AT-1012 in triplicate. Non-linear regression analysis of the saturation data resulted in Kd values of 0.25 nM, 0.54 nM, 0.97 nM, and 2.84 nM; and Bmax values of 8.28 pmol/mg protein, 7.34 pmol/mg protein, and 6.08 pmol/mg protein; and 6.32 pmol/mg protein for Scatchard analysis in the presence of 0, 5, 15, and 50 nM AT-1001, respectively. Nonspecific binding was determined by using 1 µM of AT-1012 of unlabeled epibatidine.

