
Figure 1.
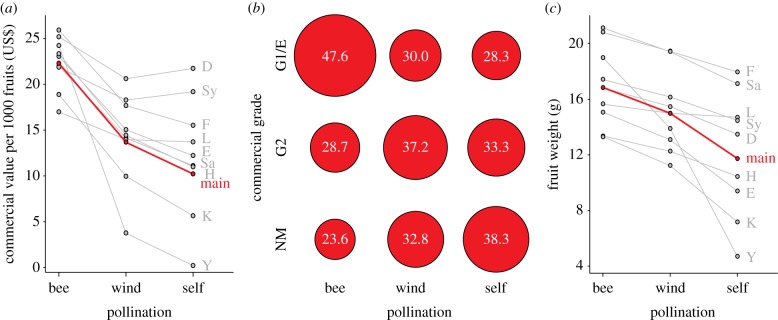
Bee pollination improved the commercial value of strawberry fruits across all varieties as a result of improved commercial grades and higher fruit weight. (a) Commercial values for each fruit were calculated in US$, by multiplying fruit weight with the prevailing market value [29], which was assessed due to harvest time and commercial grades. It was extrapolated to 1000 fruits for a better relationship to market situations. (b) Commercial grades. Fruit proportions (values within bubbles) were calculated for each commercial grade in dependence on pollination treatments (see the electronic supplementary material, S2 for division into varieties). G1/E, commercial grade one/extra; G2, commercial grade two; NM, non-marketable. (c) Weight of strawberry fruits. (a,c) Displayed values were extracted from model estimates and back transformed. Grey points display values of varieties (see abbreviations below), red points display the main effect. Lines are shown for better visualization of related points. Solid red lines for the main effect indicated that pollination treatments were stronger than differences between varieties and thus had a main effect across all varieties (see table 2 for AICc and likelihood values). Abbreviations in alphabetical order: D, Darselect; E, Elsanta; F, Florence; main, main effect; H, Honeoye; K, Korona; L, Lambada; Sa, Salsa; Sy, Symphony; Y, Yamaska.