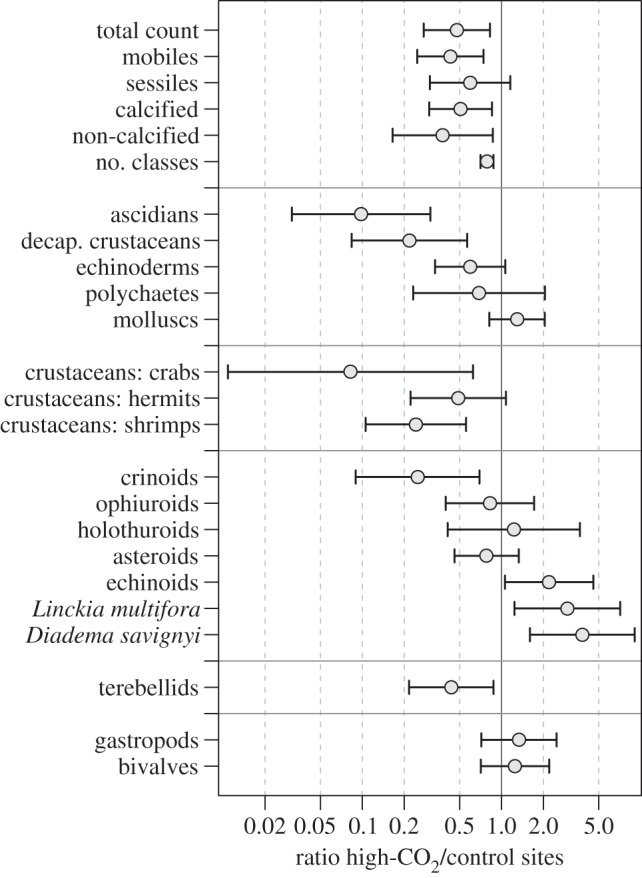
Figure 2.

Ratios of the densities or number of taxonomic units of macroinvertebrates at high-CO2 relative to control sites (n = 35 surveys). Circles mark the estimated ratios, error bars show lower and upper 95% CIs (see electronic supplementary material, tables S5 and S6). Differences are significant (p < 0.05) if the error bars do not include the value 1.0.
