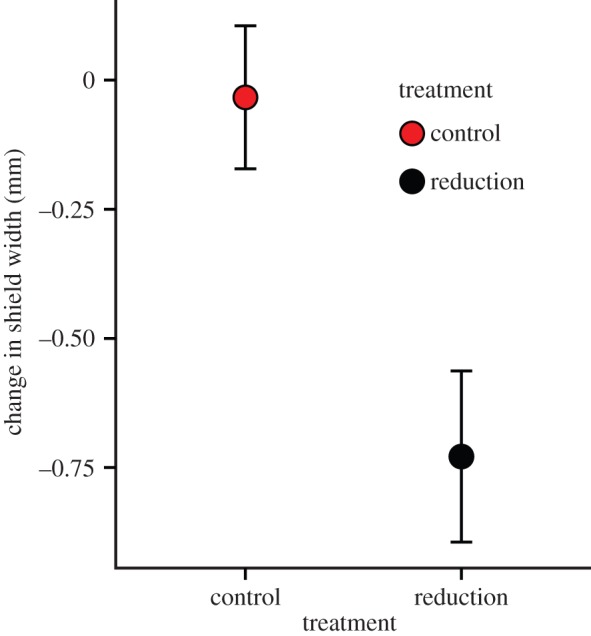
Figure 3.

The change in true shield width as a result of apparent shield manipulation. Data shown are the mean change (±s.e.) over a one-week period after manipulation for individuals that received the control (n = 9) and shield reduction treatments (n = 7). See text for details of statistical analysis. (Online version in colour.)
