Figure 11.
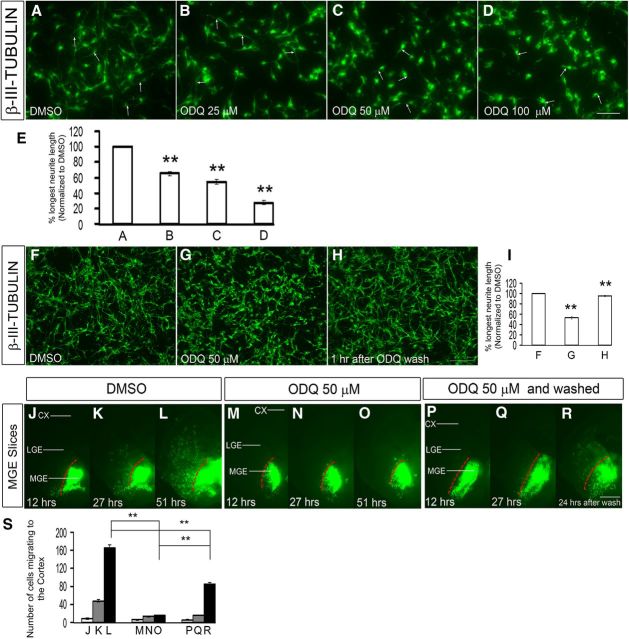
Inhibition of soluble guanylate cyclase rapidly alters the shape of MGE neurons. A–D, Dose-dependent attenuation of MGE neurite length comparing DMSO (A), 25 μm ODQ (B), 50 μm ODQ (C), and 100 μm ODQ (D) treated for 30 min followed by staining using β-III-tubulin (Tuj1) antibodies. Scale bars: A–D, 50 μm. E, Histogram showing the effect of different concentrations of ODQ (A–D) on longest neurite length, normalized to DMSO. A versus B, p = 4.667 × 10⁻⁵; A versus C, p = 5.378 × 10⁻⁶; A versus D, p = 1.535 × 10⁻⁷. F–H, ODQ attenuation of neurite length was reversible when ODQ was washed from the media as shown in H; compare with F (DMSO) and G (50 μm ODQ). Scale bars: F–H, 100 μm. I, Histogram showing the effect on neurite length when ODQ was washed from the media, normalized to DMSO. F versus G, p = 1.8 × E-6; G versus H, p = 3.4 × E-6. J–R, Inhibition of tangential migration from the MGE to the cortex was partially reversible when ODQ was removed from the media after 27 h of ODQ treatment, and image was taken 24 h after the ODQ wash in a slice electroporation experiment as shown in R compared with the unwashed specimen in O. Also compare with M–O (50 μm ODQ) and J–L (DMSO). S, Histogram quantifying the number of cells migrating to the cortex from MGE in slices. Scale bars: J–O, 500 μm. Data are the mean ± SEM. *p ≤ 0.05 (one-way ANOVA followed by Bonferroni post test). **p ≤ 0.01 (one-way ANOVA followed by Bonferroni post test). L, O, p = 1.13 × E-6; L, R, p = 4.5 × E-5; O, R, p = 0.0001.

