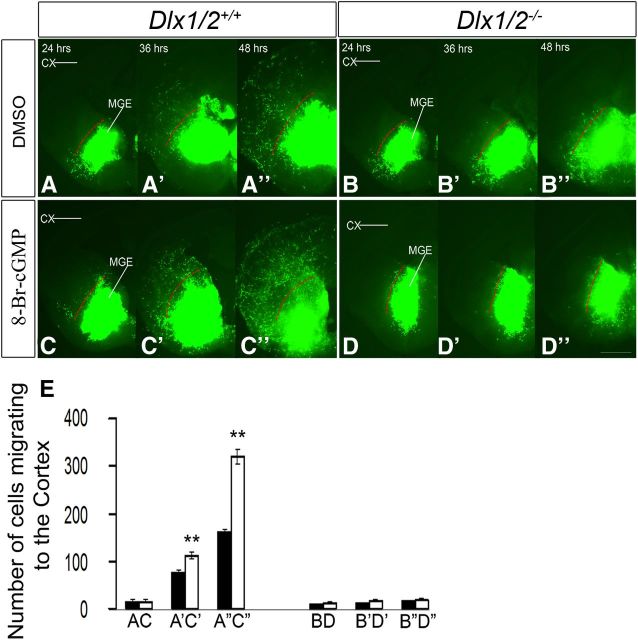
Figure 4.
A–D″, Slice electroporation migration assay. Cells were visualized by transfecting a GFP expression vector into the MGE in either the WT (A–A″, C–C″) or the Dlx1/2−/− mutants (B–B″, D–D″) treated with DMSO or 8-Br-cGMP. Migration into the LGE and cortex was assessed after 24, 36, and 48 h. E, Histogram showing quantification of the number of cells migrating to the cortex from MGE in slices. Data are the mean ± SEM. *p ≤ 0.05 (paired Student's t test). **p ≤ 0.01 (paired Student's t test). A′, C′, p = 0.018; A″, C″, p = 0.0006. Slices were grown in either DMSO or 8-Br-cGMP (500 μm). CX, Cortex. Scale bars: A–D″, 500 μm.

