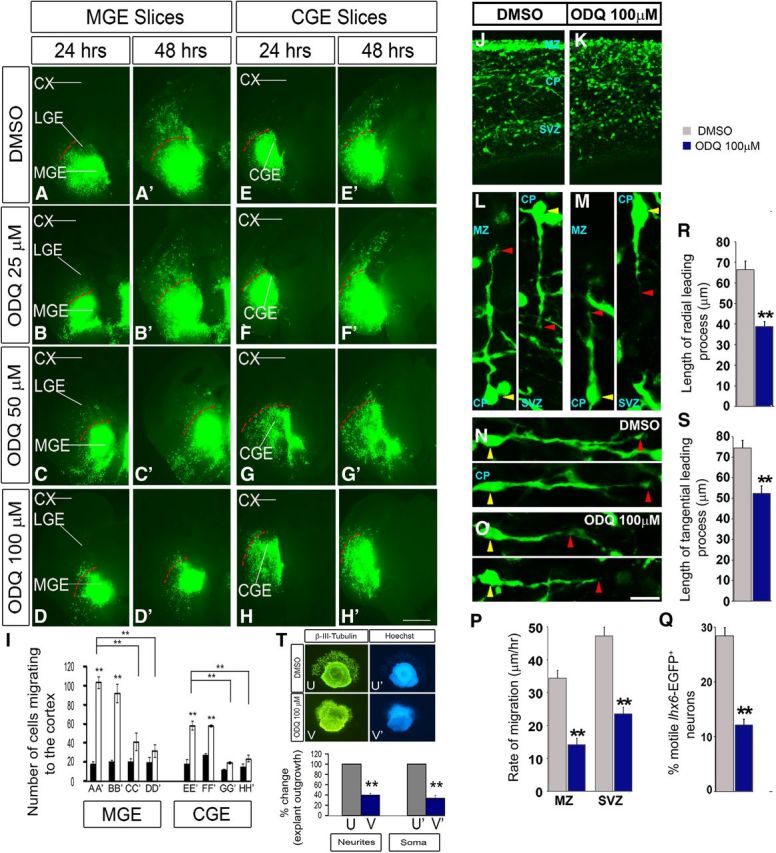
Figure 5.

Inhibition of soluble guanlyate cyclase activity with ODQ reduces interneuron process length and migration from the MGE and CGE to the cortex in E13.5 telencephalic slices. Movies 1 and 2 show additional data. A–H′, Slice electroporation migration assay. Cells were visualized by transfecting a GFP expression vector into either the MGE (A–D′) or CGE (E–H′) by electroporation; migration into the LGE and cortex was assessed after 24 and 48 h. I, Histogram showing quantification of the number of cells migrating to the cortex from MGE or CGE in slices. Slices were grown in DMSO, 25 μm ODQ, 50 μm ODQ, or 100 μm ODQ. Data are the mean ± SEM. *p ≤ 0.05 (one-way ANOVA followed by Bonferroni post test). **p ≤ 0.01 (one-way ANOVA followed by Bonferroni post test). A, A′, p = 1.1 × E-6; B, B′, p = 0.00001; A′, C′, p = 0.00358; A′, D′, p = 0.00142; E, E′, p = 1.3 × E-6; F, F′, p = 0.00003; E′, G′, p = 0.00016; E′, H′, p = 0.00037. CX, Cortex. Scale bars: A–H′, 500 μm. J, K, Confocal image showing Lhx6-GFP expression in an E15.5 brain slice (200 μm) treated with either DMSO or ODQ (100 μm) for 1 h. L–O, Interneurons from the CP, oriented in a radial (L, M) or tangential (N, O) direction, are aligned by their cell soma (yellow arrowhead). The leading process length was assessed from the base of the soma to the tip of the leading process (red arrowhead). P, Quantification of rates of tangential migration through the MZ and SVZ are based on live imaging of E15.5 Lhx6-GFP+ ODQ-treated and DMSO-treated control cortices for 12 h. MZ, p = 4.01 × E-7; SVZ, p = 1.84 × E-8. Q, Quantification of the number of motile cells (i.e., cells migrating at a rate of >5 μm/h) within the CP of ODQ-treated and DMSO-treated control cortices (p = 0.00021). R, S, Quantification of leading process length of interneurons oriented in either radial or tangential direction (N = 5). *p < 0.001 (Student's t test). R, p = 1.16 × E-5. S, p = 0.00043. Scale bars: J, K, 110 μm; L, M, 28 μm; N, O, 30 μm. T, Matrigel explant cell migration assays of E13.5 MGE showing the outgrowth of neurites/cell processes (β-III-tubulin+) (U, V) and migration of the soma/nucleus (Hoechst+) (U′, V′) treated with DMSO (U, U′) or ODQ (100 μm) (V, V′). Bottom, Histograms reporting the percentage change in the MGE explant outgrowth. Data are the mean ± SEM. *p < 0.05 (paired Student's t test). **p < 0.01 (paired Student's t test). U, V, p = 0.00011; U′, V′, p = 5.1 × E-6.
