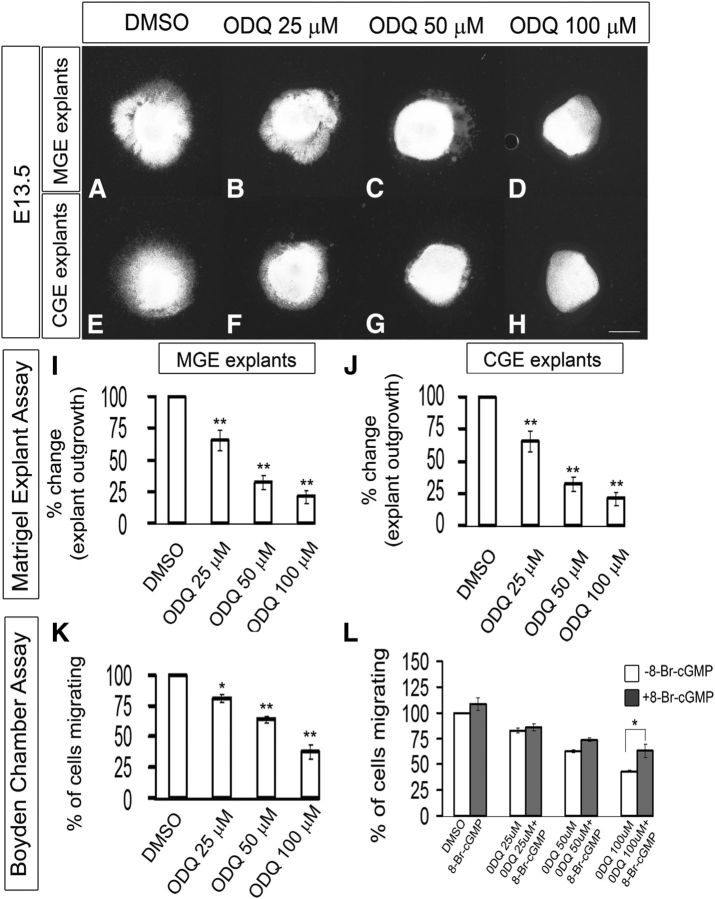
Figure 6.
Inhibition of soluble guanlyate cyclase activity with ODQ blocks cell migration from E13.5 explants of the MGE and CGE, assessed using Matrigel explants and Boyden chamber assays. A–H, Matrigel explant cell migration assays of E13.5 MGE and CGE comparing DMSO (A, E), 25 μm ODQ (B, F), 50 μm ODQ (C, G), and 100 μm ODQ (D, H). I, J, Histograms reporting the percentage change in the MGE (I) and CGE (J) explant outgrowth as a function of ODQ dose using one-way ANOVA followed by Bonferroni post test. I, DMSO versus ODQ 25 μm, p = 0.01346; DMSO versus ODQ 50 μm, p = 1.52 × E-4; DMSO versus ODQ 100 μm, p = 4.72 × E-5. J, DMSO versus ODQ 25 μm, p = 0.01044; DMSO versus ODQ 50 μm, p = 0.00245; DMSO versus ODQ 100 μm, p = 3.156 × E-4. Scale bars: A–H, 500 μm. K, Boyden chamber assay showing that progressively increasing concentration of ODQ inhibit more migration. Data are the mean ± SEM. *p ≤ 0.05 (one-way ANOVA followed by Bonferroni post test). **p ≤ 0.01 (one-way ANOVA followed by Bonferroni post test). DMSO versus ODQ 25 μm, p = 0.02589; DMSO versus ODQ 50 μm, p = 4.29 × E-4; DMSO versus ODQ 100 μm, p = 6.73 × E-4. L, Boyden chamber assay showing that 8-Br-cGMP partially counteracted the effect of 50 and 100 μm ODQ. However, the rescue in migration by 8-Br-cGMP was statistically significant in 100 μm ODQ (p = 0.03).

