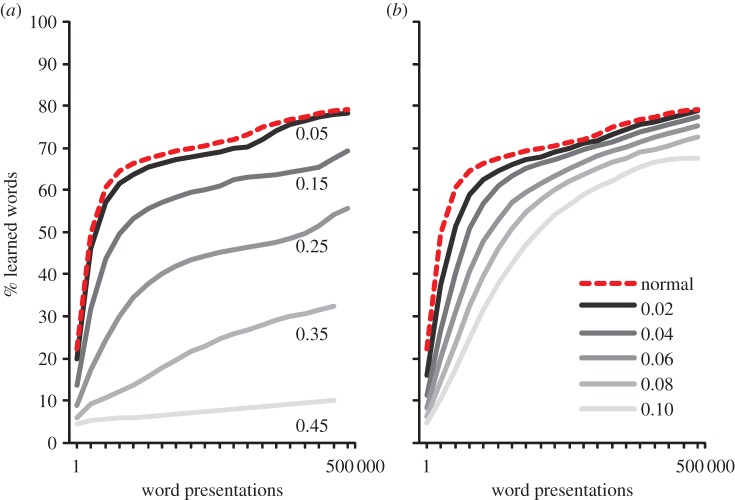
Figure 5.
Learning to read with phoneme or visual deficits. (a) Phoneme deficits were simulated by changing a correctly assembled phoneme with a phonetically similar but incorrect phoneme with a certain probability (0.05, 0.15, 0.25, 0.35 and 0.45). (b) Visual deficits were simulated by switching a letter with the letter next to it with a certain probability (0.02, 0.04, 0.06, 0.08 and 0.10). The dotted line represents the unimpaired network. All simulations were run with a word recognition threshold of 0.15. (Online version in colour.)

