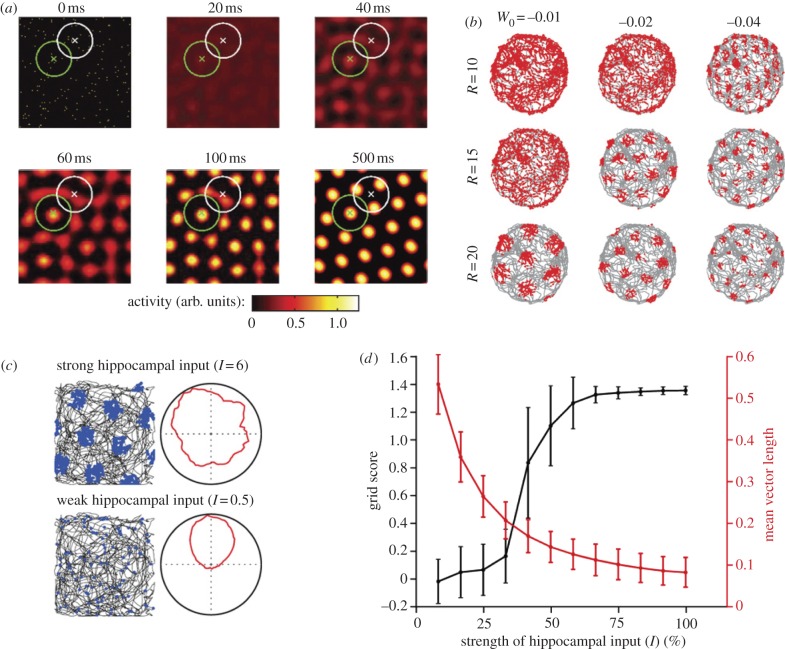
Figure 1.
Inhibition-based attractor network model for grid cells. (a) A hexagonal grid pattern forms spontaneously (here over a period of 500 ms) on a two-dimensional neuronal lattice consisting of stellate cells that have all-or-none inhibitory connections with each other. Neurons are arranged on the lattice according to their spatial phases. Activity is colour-coded, as indicated by the scale bar at the bottom. Connection radii R of two example neurons are shown as white and green circles (diameter 2R). Note lower activity where the circles overlap (at 500 ms). (b) Simulated single neuron activity (red dots) over 10 min of foraging in a 1.8 m diameter circular arena. W0 is the strength of the inhibitory connectivity of the network; R is the radius. Note that W0 and R control the size of the grid fields and their spacing. (c) Effect of excitatory drive from the hippocampus. Spike distribution plots (as in b) and directional tuning curves (firing rate as a function of direction) for two example cells in the presence of strong hippocampal output (top) and weak hippocampal output (bottom). (d) Grid scores (sixfold rotational symmetry) and mean vector length (directional tuning) as a function of the strength of external input (means ± s.e.m.). With large hippocampal inputs, high grid scores are obtained, as in the top image in (c). When the external input is decreased below a critical amount, as in the bottom image of (c), the activity on the neuronal sheet gets easily distorted and hexagonal structure is not detectable over time. At the same time, the head-directional input becomes the dominant source of input and the neurons show high directional tuning. (a,b) Adapted from [32]; (c,d) from [33].

