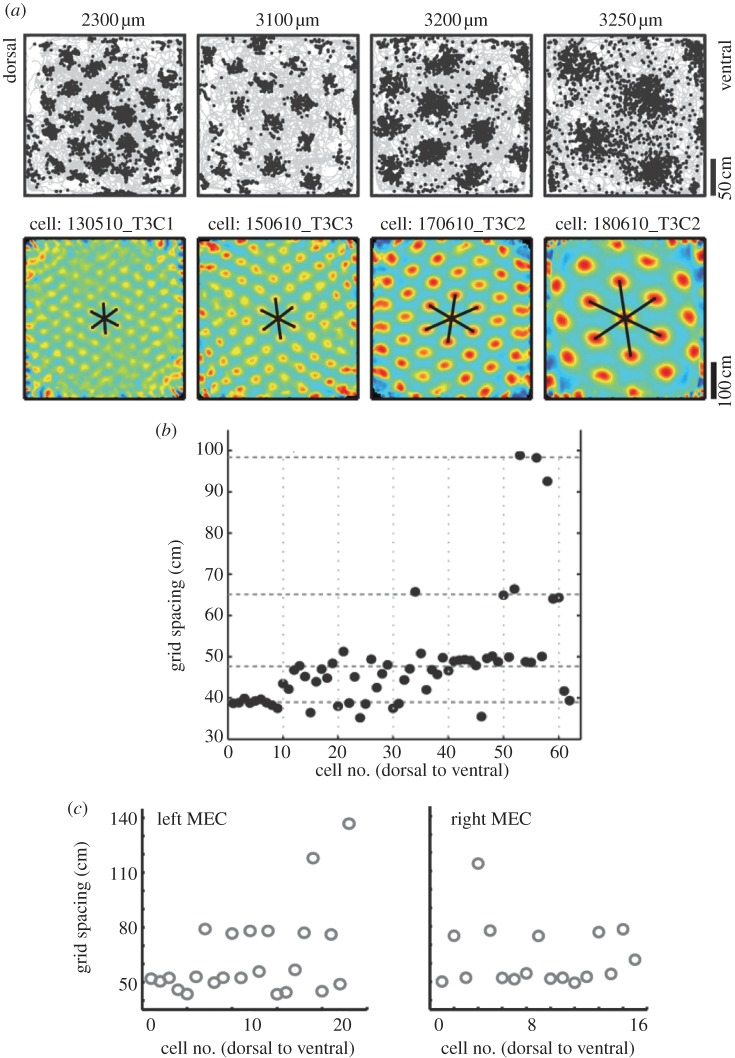
Figure 2.
Modular organization of the grid map. (a) Examples of grid cells belonging to modules with different grid spacing. Left to right: Spike maps (top row) and colour-coded autocorrelation maps (bottom row) for four example cells. Trajectory of the rat is shown in grey, with all of the cell's spike locations superimposed in black. Colour scale for the autocorrelation maps is from blue (r =−1) to red (r = 1). Recording depth along the dorsoventral axis of MEC is indicated at the top. (b) Step-like organization of grid scale. Grid spacing is shown as a function of position along the recording track in MEC, with cells (dots) rank-ordered from dorsal to ventral. Note that grid spacing clusters into four different values in this recording. Horizontal lines indicate mean values for k-means-identified clusters. (c) Step-like changes in grid spacing in grid cells recorded simultaneously in left and right MEC. Cells are numbered according to position along the dorsoventral MEC axis. Note discrete nature of the distributions as well as identical values for grid spacing in the two locations. (Adapted from [46].)

