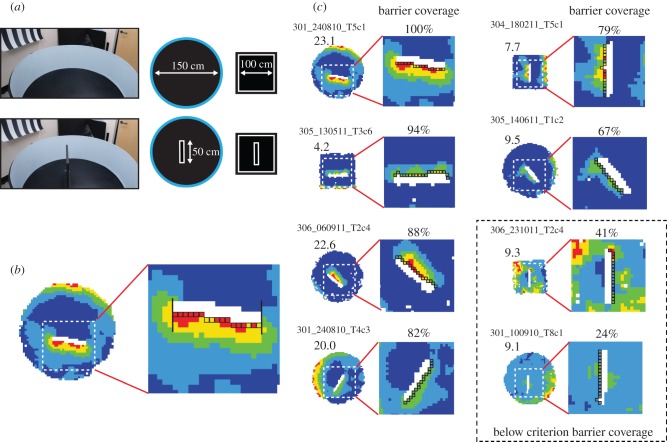
Figure 1.
The procedure used to classify boundary cells as BVCs. (a) Photo and diagram of the barrier insertion manipulation. An upright barrier (50 cm long, 50 cm high, 3 cm thick, painted black matt) was inserted into either the walled circular environment (150 cm diameter), which had light matt walls, or the walled square environment (100 × 100 cm), which had black matt walls. (b) Firing rate map for a cell in a barrier trial whose second field extended along the entire length of predicted side of the barrier. White dashed box within rate map (left) and red lines indicate the area around the inserted barrier where the second field occurs, depicted in the zoomed-in firing rate map (right). The criterion for a cell to be classified as a BVC was that firing was required to be at least 40% of the locational peak firing rate along 50% or more of the bins directly abutting the predicted side of the barrier. The bins are indicated on the close-up as black-sided squares. (c) Representative examples of cells which did (n = 6 shown), and did not (n = 2 shown inside dashed box), meet the BVC field repetition criterion described in (b). For each cell, as in (b), we show whole-environment rate map (left), and close-up of the region containing the second field (right). Locational peak rate in hertz is shown top left of whole-environment rate map in this and subsequent figures. The proportion of barrier coverage (i.e. percentage coverage of second field along predicted side of the barrier) is shown above the close-up rate map. For instance, ‘67%’ indicates that firing rate was at least 40% of the peak firing rate in two-thirds of the bins along the length of the inserted barrier. 42/46 BVCs were classified using this criterion.

