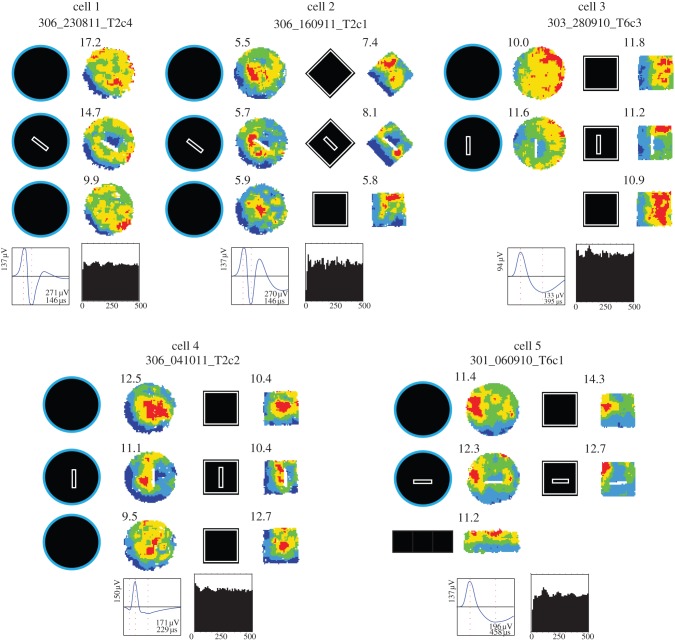
Figure 6.
Boundary-off cells. Five examples of boundary-off cells recorded in baseline and barrier trials. Below the rate maps is the spike waveform, bottom-right text stating peak amplitude (the highest positive-to-negative or negative-to-positive amplitude, µV) and negative peak-to-trough interval (µs) and the temporal autocorrelations (0–500 ms). Waveform and theta-modulation data come from the first large walled circle trial of the day.

