
Figure 1.
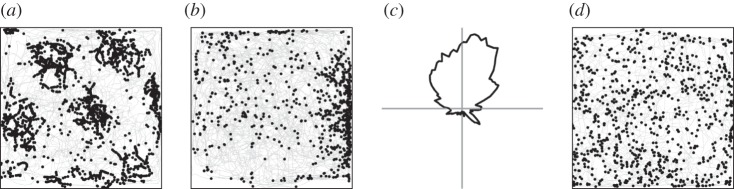
(a) Grid cell, (b) border cell, (c) head-direction cell and (d) non-spatial cell. For the grid cell, the border cell and the non-spatial cell, the animal's trajectory is shown in grey with spike locations superimposed in black. For the head-direction cell, firing rate is shown as a function of head-direction.