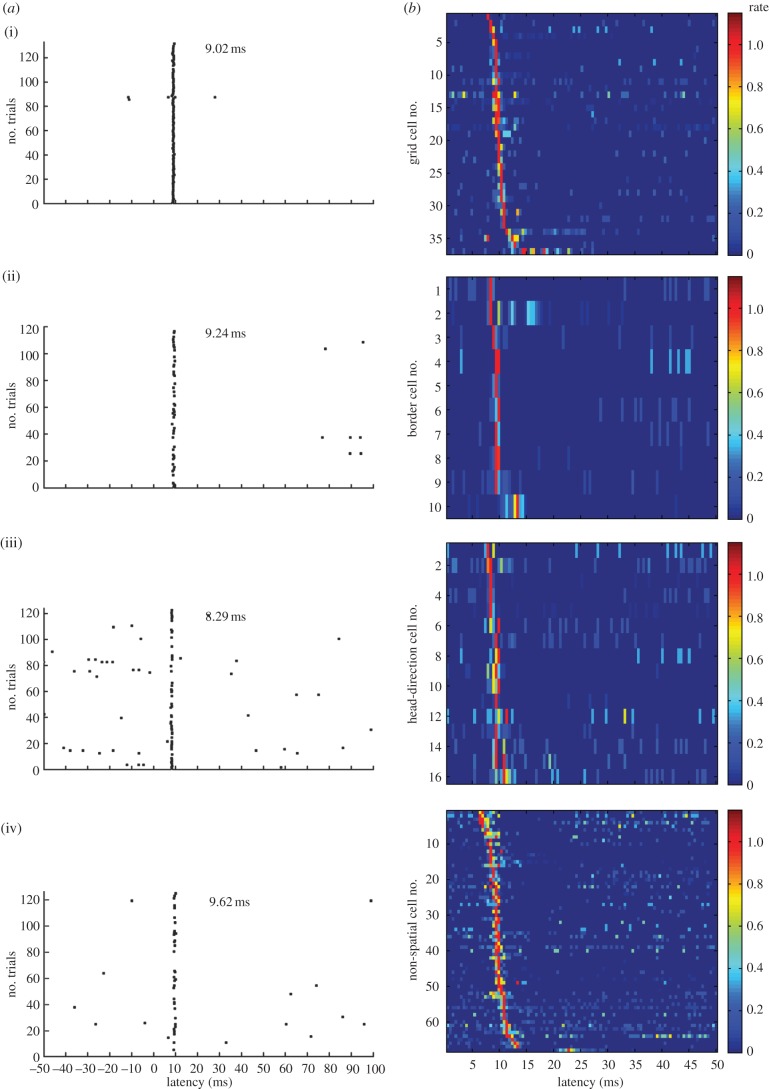
Figure 3.
Photoinduced spike activity in multiple functional cell types. (a) Spike rasters for the 100 ms following photostimulation above the recording site in the MEC for (i) one grid cell, (ii) one border cell, (iii) one head-direction cell and (iv) one non-spatial cell. Light was on from 0 to 3.5 ms. Dots indicate spike times. Note reliable discharge at a fixed latency after the onset of stimulation. (b) Firing latencies for the entire sample of photoresponsive MEC neurons. Colour-coded firing rates are shown as a function of time after the start of photostimulation (0–50 ms). Each row shows data for one cell. Firing rate is shown for successive time bins of 0.5 ms. Rates are normalized to peak rate. Dark blue is silent, red is peak rate; rates are normalized to peak (colour scale to the right). Modified with permission from [27].

