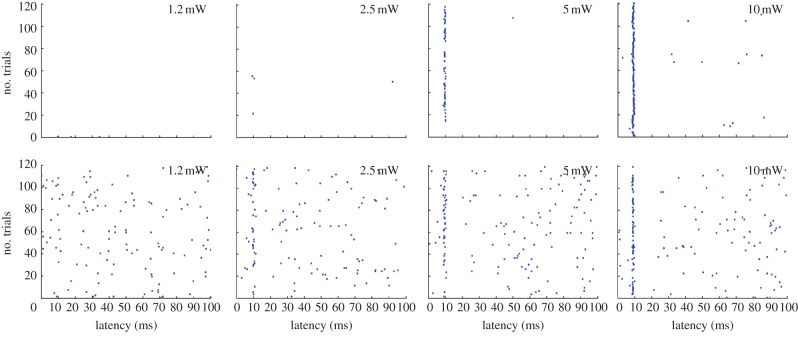
Figure 5.
Effect of power density (photostimulation intensity) on response latency for two example cells in MEC (top and bottom rows, respectively). Raster diagrams show light-induced firing at power densities increasing from 1 to 10 mW mm−2. Each row shows the first 100 ms of one stimulus period (trial). Dots indicate spike times. Note reliable discharge at an almost fixed latency (approx. 9–10 ms) across a wide range of intensities (2.5–10 mW mm−2). Adapted with permission from [27].

