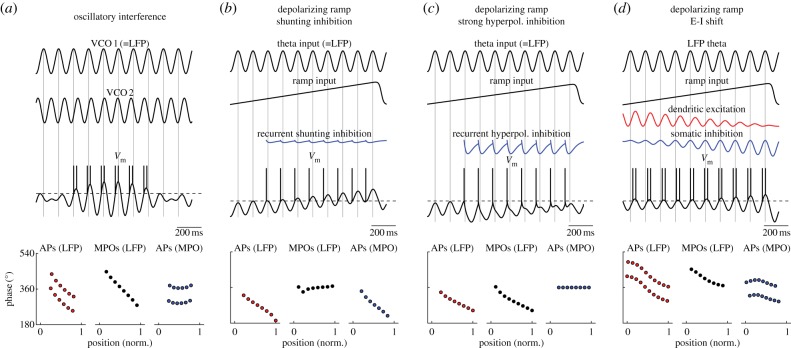
Figure 6.
Comparing models of phase precession to experimental data. (a–d) Schematic drawings of phase precession models. Phase precession (bottom) is plotted as in figure 5a. (a) An oscillatory interference model with two VCO inputs correctly predicts the experimentally observed phase precession. (b) A depolarizing ramp model with theta input phase-locked to LFP theta produces phase precession of APs with respect to LFP theta. Shunting recurrent inhibition prevents repetitive firing within theta periods, and thereby sharpens phase precession. However, APs show phase precession with respect to LFP theta, contrary to the experimental data. (c) Strongly hyperpolarizing recurrent inhibition abbreviates theta MPOs so that the experimental phase precession is reproduced. (d) Both dendritic excitatory inputs and somatic inhibitory inputs are phase-locked to LFP theta, but phase-shifted by 60° against each other. During the depolarizing ramp, excitatory drive decreases and inhibitory drive increases because of opposing changes in driving force. This shift in excitation–inhibition balance can produce phase precession of action potentials with respect to LFP theta [83].

