
Figure 2.
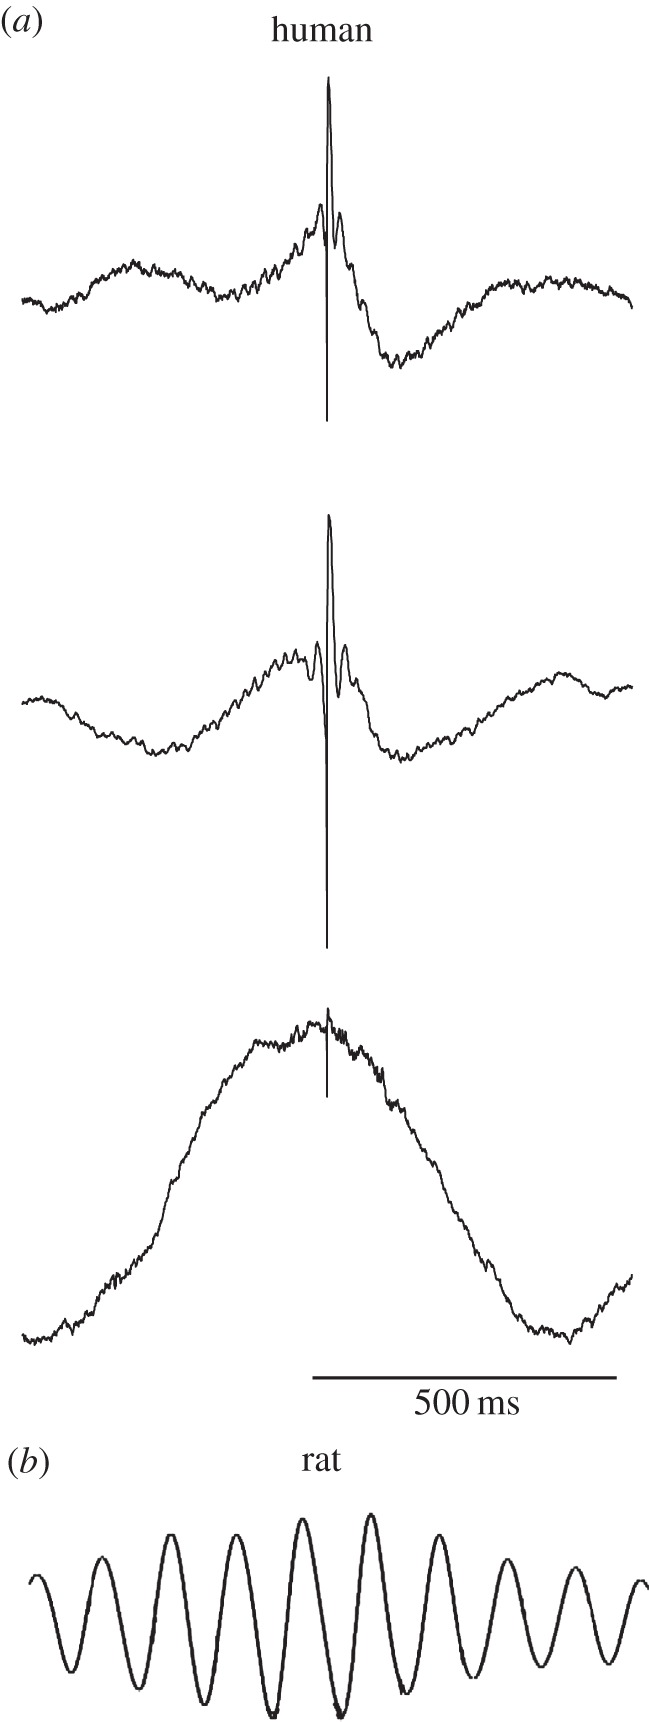
Hippocampal oscillations in rodents and humans. (a) Human hippocampal theta oscillations. Plots show spike-triggered average hippocampal field potentials from three separate patients (Reproduced with permission from [52]). (b) Example of a rodent hippocampal theta oscillation. Plot shows the mean autocorrelation of a theta signal from [53] (Reproduced with permission). Note that plots in (a,b) share the same timescale, as indicated by the scale bar in the bottom panel.