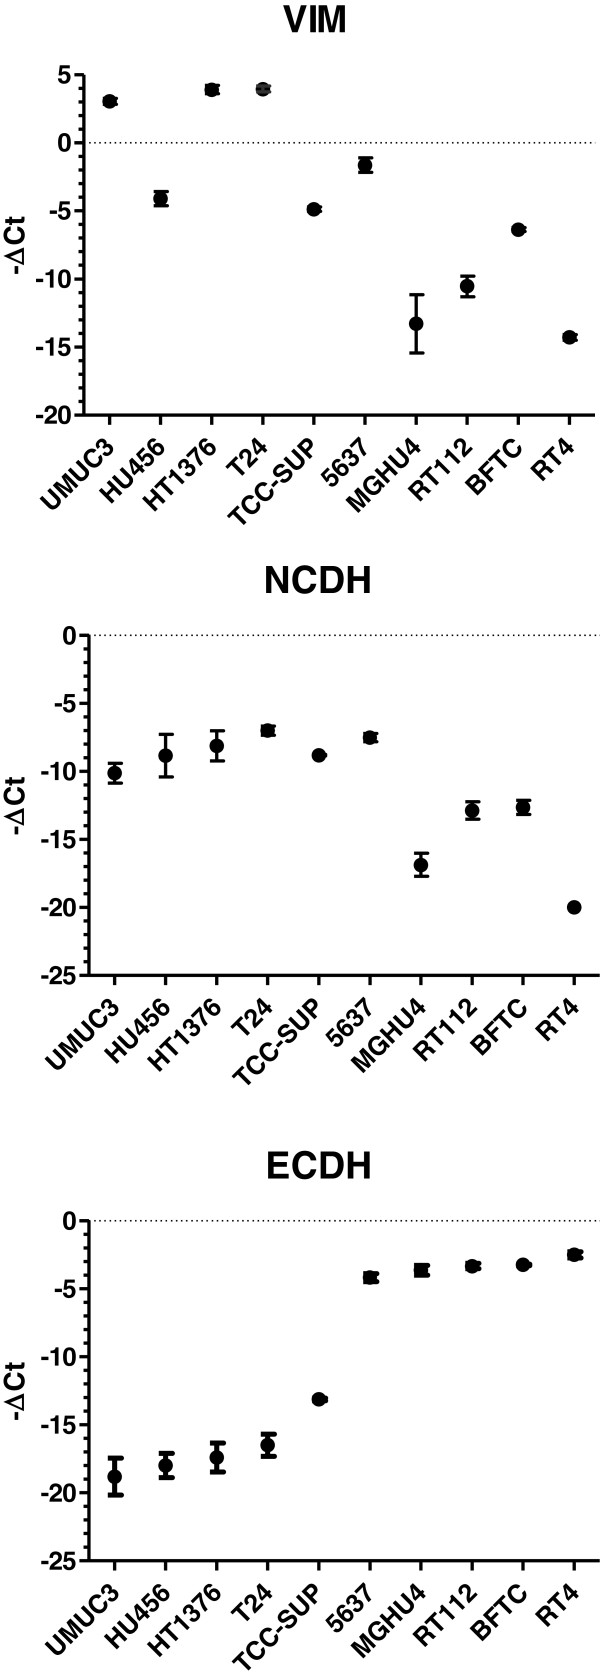
Figure 2.
Quantification of mRNA encoding vimentin (VIM), N-cadherin (NCDH) and E-cadherin (ECDH) by realtime RT-PCR in human bladder cancer cell lines. Displayed are the -ΔCt values (Ct, cycle of threshold) normalized to β-actin and PBGD mRNA (mean, standard deviation, n ≥ 3). The order of cell lines is the same as in the Western-blot and allows direct comparison with Figure 1. Linear regression analysis revealed strong correlation between mRNA and protein levels of NCDH, ECDH and VIM, respectively (E-cadherin, r = 0.831, p = 0.0029; N-cadherin, r = 0.794, p = 0.0061; vimentin, r = 0.858, p = 0.0015).

