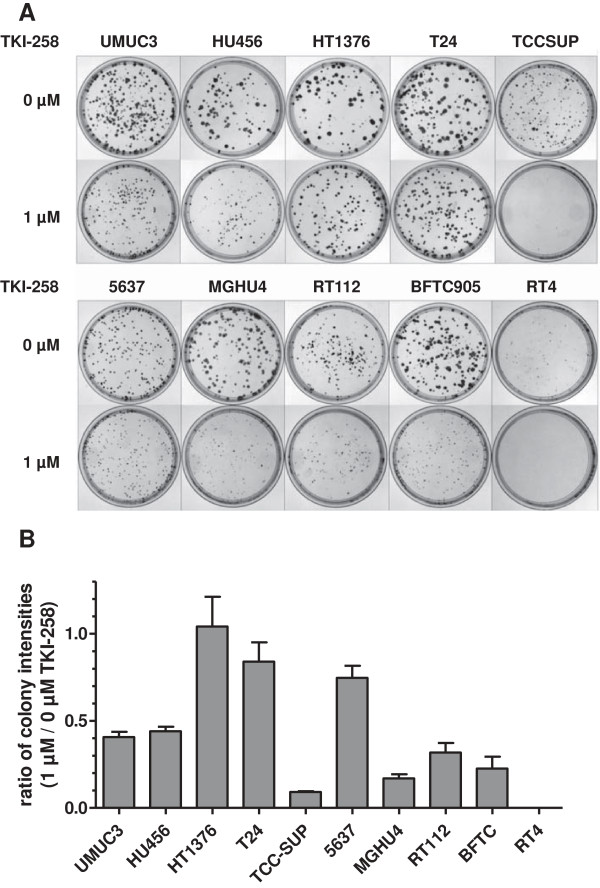
Figure 6.
Calculation of the clonogenic survival fraction after TKI-258 treatment. A) Colony formation assay of control cells TKI-258 [0 μM] and cells treated with TKI-258 [1 μM]. Displayed are the plates after staining with crystal violet. B) The ratio of signal intensity of the plates treated with TKI-258 [1 μM] versus control [0 μM] is displayed indicating the clonogenic survival fraction as a quantitative parameter of treatment efficiency with TKI-258.

