Figure 7.
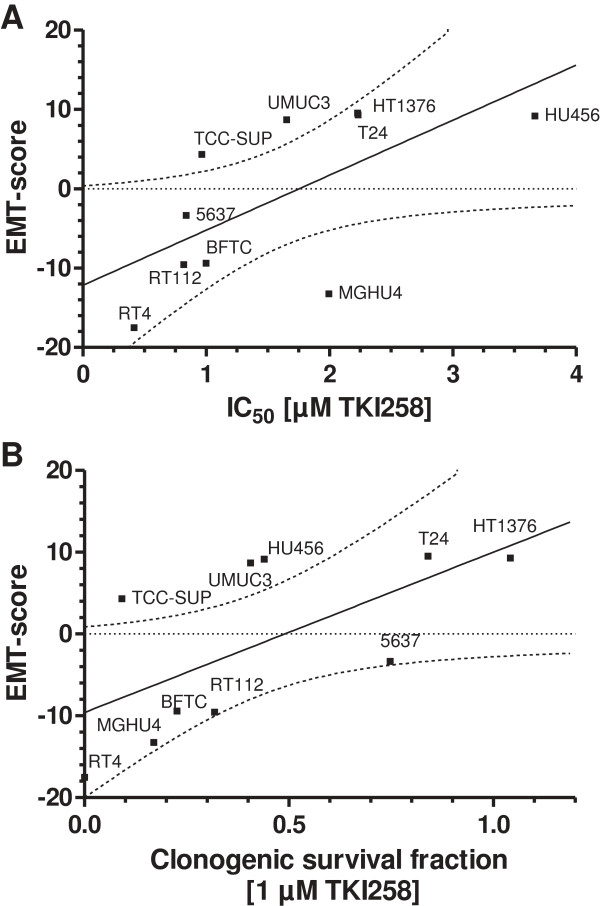
Linear correlation analyses of the EMT-score with TKI-258 responses. A) Correlation of EMT-score and IC50 values (r = 0.637, p = 0.0474). B) Correlation of EMT-score and clonogenic survival fraction (r = 0.635, p = 0.0483). The dotted lines represent the 95% confidence band of the best fit, respectively.

