Figure 3.
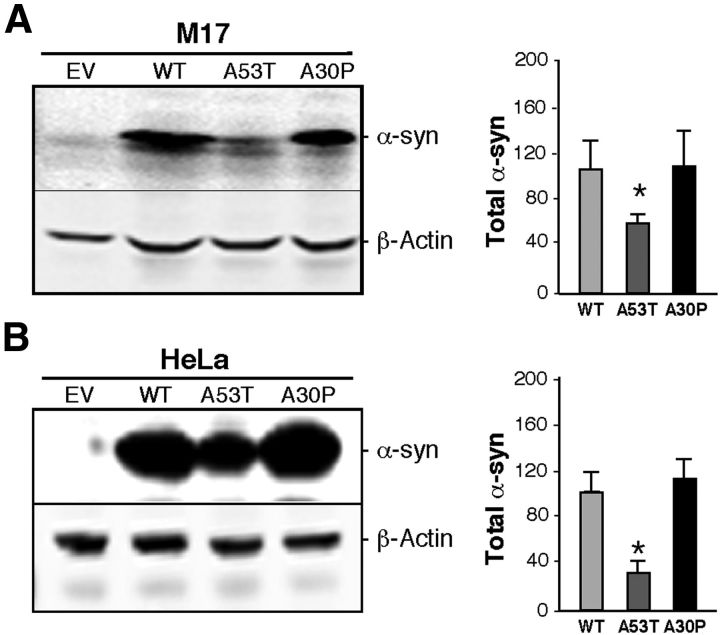
Expression of α-syn in M17 and HeLa cells. A, Left, Example of a Western blot of the expression of α-syn in EV and stably transfected WT, A53T, and A30P α-syn-expressing M17 cells relative to that of control β-actin. Right, Quantitation of the total α-syn in the blots exemplified at left, in arbitrary units; n = 3; asterisk denotes significance versus WT. B, Expression and quantitation of α-syn in HeLa cells, as in (A). In both cases, note reduced expression in A53T cells.

