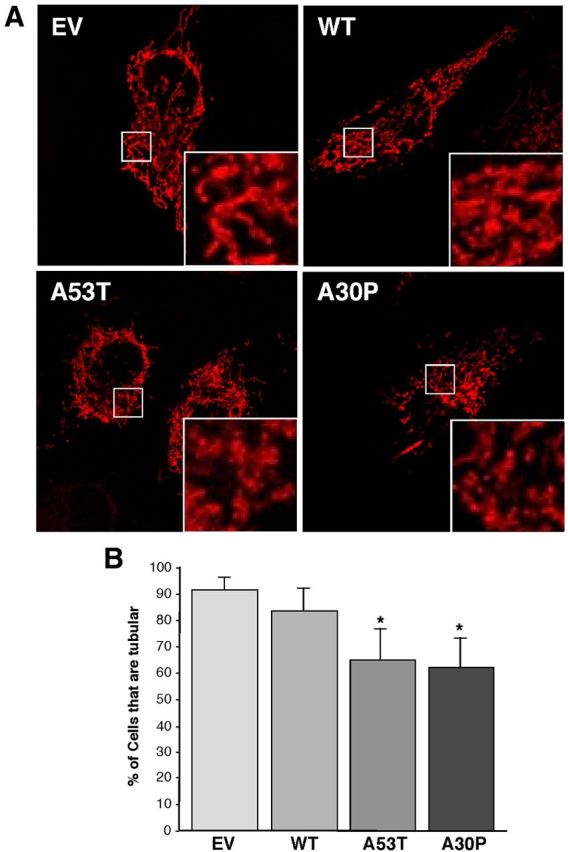
Figure 8.

Mitochondrial fragmentation in HeLa cells. A, Representative images of mitochondria in α-syn-expressing cells labeled with pDsRed2-Mito. Insets, Enlargements of the indicated regions (small boxes). B, Quantitation of fragmentation of the cells in A, measured as the percentage of all cells that contained predominantly fragmented tubular mitochondria. *Significant difference versus EV (p < 0.05); n = 5 independent experiments.
