
Figure 2.
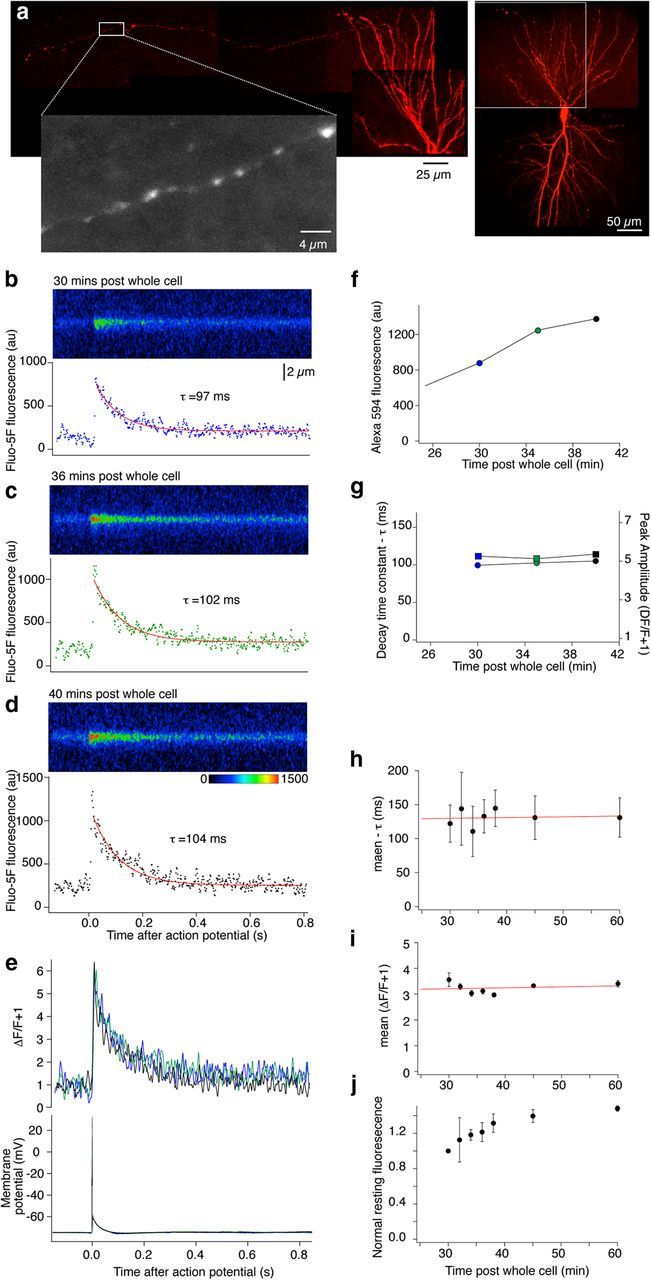
Ca2+ transients are reliably recorded in CA1 pyramidal neuron presynaptic terminals within the subiculum following labeling from a whole-cell electrode on the soma. a, Composite image of CA1 neuron reconstructed from 3D stacks obtained by scanning confocally. The neuron was filled with dyes from the electrode: Alexa (250 μm) to label the neuron (shown in red) and to trace axons to subiculum to identify presynaptic varicosities (expanded, grayscale) and Fluo-5F (200 μm) for Ca2+ measurements. b, After identifying a presynaptic varicosity the neuron was stimulated with single action potentials and individual Ca2+ transient responses were obtained by line scanning one terminal varicosity. No responses could be recorded from axons between the varicosities. Responses were recorded over time as the dye concentration rose by diffusion into the presynaptic varicosities (c, d). The integrated signals were calculated from these regions (graphs below line scan images). Peak values of signal intensity and rate of response decay were obtained from single exponential fits to these data. e, The data in b–d were expressed as (ΔF/F + 1) and overlaid. Colors from b–d. f, Graph demonstrating rise in intensity of Alexa 594 in this neuron's terminal over the time course of the experiment as the dye diffused into the terminal varicosities. g, Graph of decay rate (τ, left axis) and peak value of (ΔF/F + 1) for this presynaptic varicosity during the experiment. h, Mean decay rate (τ) and (i) the mean peak (ΔF/F + 1) during the course of the experiments (n = 6 preparations). j, Graph showing rise in intensity of Alexa 594 signal normalized to the first time point of recording in all terminals (same 6 preparations as h and i).