Figure 4.
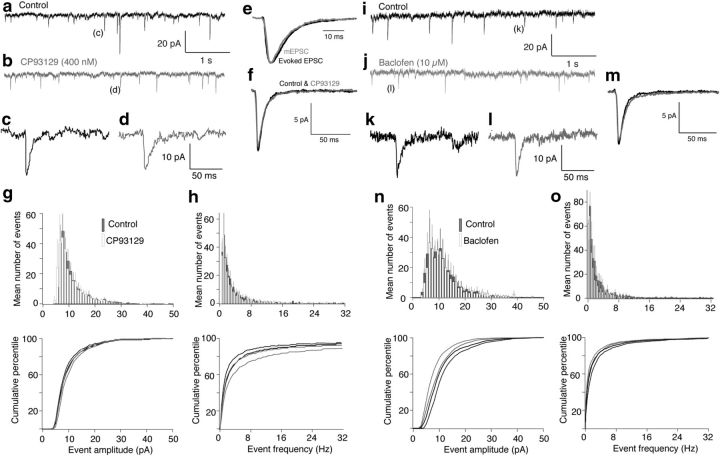
Neither 5-HT1BRs nor GABABRs alter spontaneous release in the subiculum. a, Spontaneous events recorded in whole-cell voltage-clamped subicular pyramidal neurons. Recordings were in TTX, bicuculline and AP-5 to isolate AMPAR-mediated mEPSCs. b, The 5-HT1BR agonist, CP93129 (400 nm), was applied. c, d, Examples of detected events in a and b. e, The kinetic profile of averaged detected mEPSCs (gray) was compared with evoked responses obtained before addition of TTX in the same neurons (black). Events were scaled the same arbitrary amplitudes. f, Means of mEPSCs detected in Control (black) and in CP93129 (gray). The agonist altered neither amplitude nor kinetic profile. g, Mean event amplitude histograms were plotted for all cells examined before (gray) and after CP93129 (white). Bars indicate SEMs obtained comparing across preparations (n = 5). Cumulative histograms are plotted below (Control, black; CP93129, gray). SEMs represented as Control (black dashed line above curves) and in CP93129 (gray dashed line below curve). h, Event frequency distribution curves for the same datasets as g. Grayscale and SEMs marked in the same way. i, Spontaneous events were recorded as in a. j, The GABABR agonist, baclofen (1 μm), was applied. k, l, Examples of detected events in i and j. m, Means of mEPSCs detected in Control (black) and in baclofen (gray). The agonist altered neither amplitude nor kinetic profile. n, Mean event amplitude histograms were plotted in Control and baclofen (10 μm) as for g. o, Event frequency distribution histograms for the same datasets as in n.

