
Figure 5.
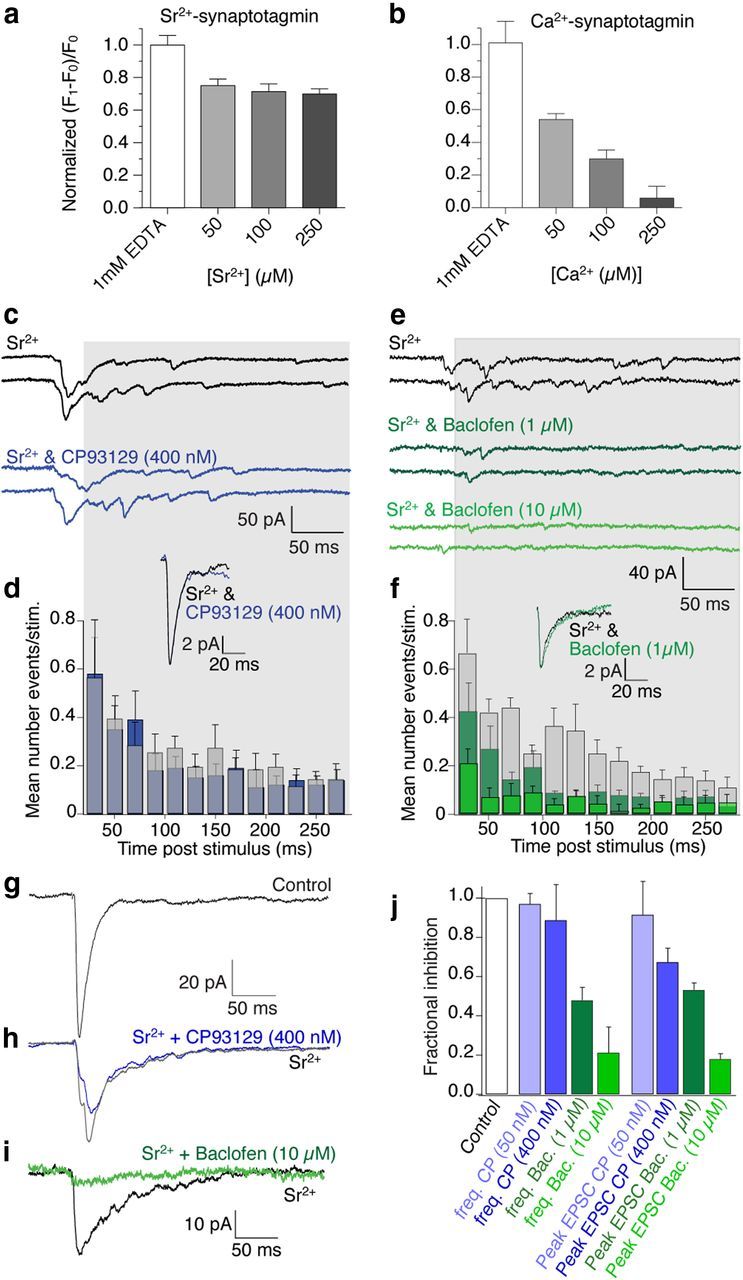
GABABRs but not 5-HT1BRs inhibit Sr2+-evoked neurotransmission. a, Graphs of normalized fluorescence of MIANS-labeled Gβγ bound to t-SNARE complexes in vitro. Synaptotagmin I in increasing [Sr2+] slightly reduces Gβγ binding to t-SNAREs. Binding of 1 μm t-SNARE to 20 nm MAINS-Gβγ was measured by fluorescence enhancement. b, In contrast, synaptotagmin I in Ca2+ substantially reduced fluorescence [Ca2+] dependently. c, Examples of Sr2+-evoked EPSCs in subicular pyramidal neurons and in CP93129 (400 nm; blue) following stimulation of CA1 pyramidal neuron axons. d, Frequency distribution from gray region across traces in c; mean number of events/stimulus from all neurons of 40 stimuli in each neuron in Sr2+ and in Sr2+ plus CP93129 (blue). Inset shows mean of detected asynchronous events in Control and in CP93129 showing no effect on detected event amplitudes or kinetic profiles. e, Sr2+-evoked EPSCs in another cell (Control, black) and in baclofen (1 μm; dark green and 10 μm; green). f, Frequency distribution from gray region across traces in e plotted in Control (black) and baclofen (1 μm; dark green and 10 μm; green). Data are from all examined neurons. Inset shows mean of detected asynchronous events in Control and in baclofen showing no effect on detected event amplitudes or kinetic profiles even as the frequency of events was reduced. g, Mean of EPSCs in Ca2+ (Control). h, Sr2+ (gray), Sr2+ + CP93129 (blue; 400 nm). i, Mean of EPSCs in Sr2+ (black) and Sr2+ + baclofen (10 μm; green). j, Summary of CP93129 effects (50 nm; n = 3 and 400 nm; n = 4) and baclofen (1 μm; n = 5 and 10 μm; n = 4) against frequencies and peak amplitudes in Sr2+.