
Figure 6.
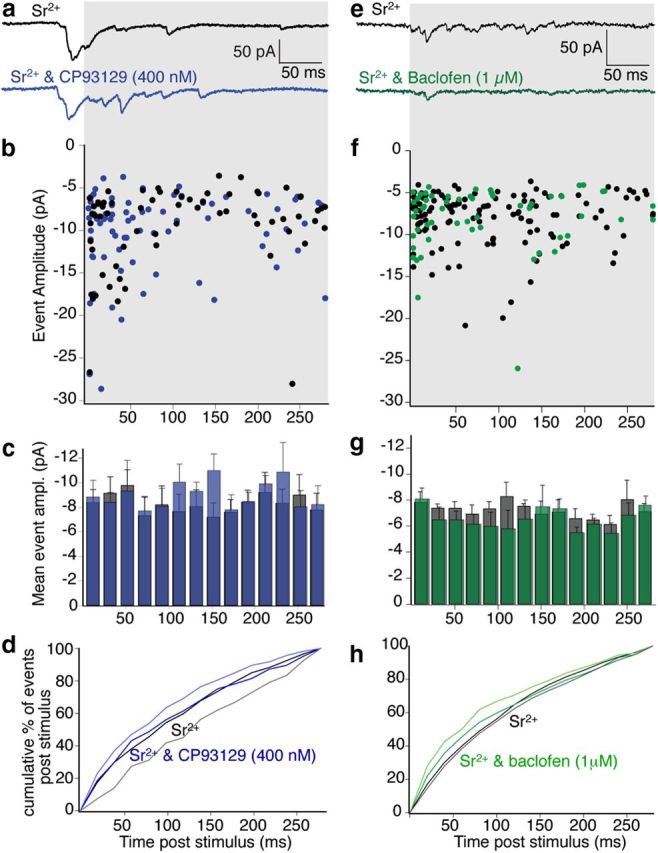
Asynchronous event amplitude distributions for evoked events in Sr2+ were not affected either by 5-HT1B or GABABR activation. a, Examples of Sr2+-evoked EPSCs in subicular pyramidal neurons and in CP93129 (400 nm; blue) following stimulation of CA1 pyramidal neuron axons (as for Fig. 5; to indicate relative timing of events in the sweep). b, Event amplitudes from the same 40 sweeps used for frequency distribution (Fig. 5) plotted against time of detection poststimulus in Control (black) and CP93129 (blue) during the region of the traces shown in gray background. c, Amplitude distribution from gray region across traces in a; mean amplitude of events from 40 stimuli in Sr2+ (gray) and in Sr2+ plus CP93129 (blue). d, Cumulative amplitude distribution of data plotted in histogram. Sr2+ (black) and Sr2+ and CP93129 (blue) counting events from the first to last bin in the sweep. Cumulative SEs are plotted for Sr2+ in (gray lower line) and Sr2+ and CP93129 (light blue line). (Data in c and d are from all recorded neurons.) e–h, Data obtained in Sr2+ and Sr2+ plus baclofen (1 μm) analyzed as for the data using CP93129. (Data in g and h are from all recorded neurons.)