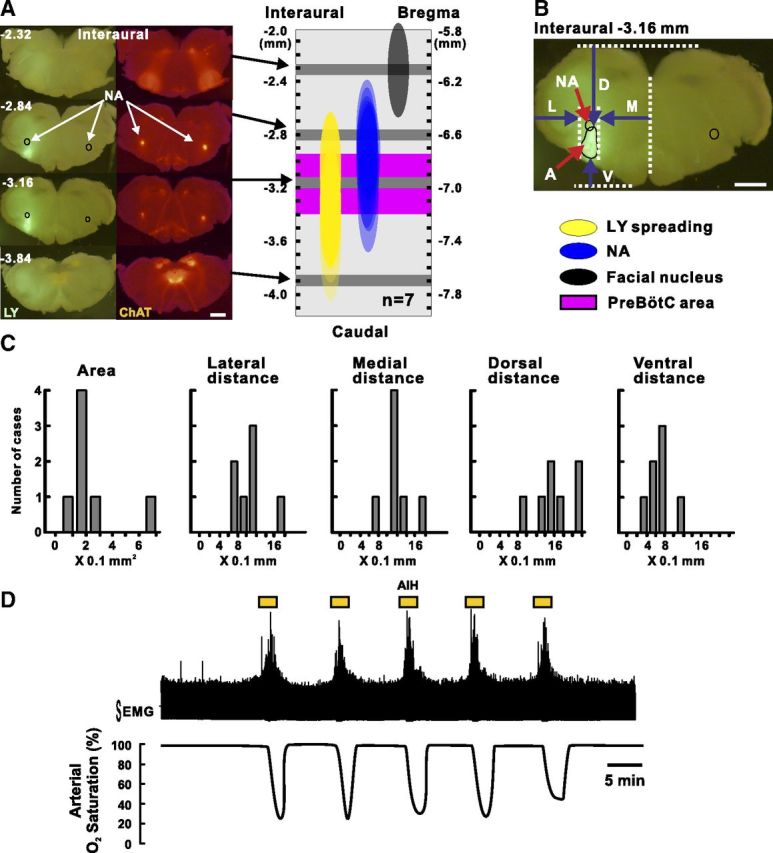
Figure 6.

Methods for drug injection in the preBötC area and AIH exposure in anesthetized mice in vivo. A, The left shows serial sections obtained from the brainstem of a mouse injected with LY (fluorescent green) in the preBötC area (for details, see Materials and Methods). Cholinergic neurons (red fluorescent) are labeled by a fluorescent protein thanks to the genetic construct of the mice (Ai27/ChAT mice) we used in this case. The right shows LY spreading in a reconstructed scheme based on measurements realized in seven injected mice. Note the large overlap between LY staining and preBötC. Scale bar, 1 mm. B, Single section representing the landmarks taken to measure the LY spreading. L, Lateral distance; M, medial distance; D, dorsal distance; V, ventral distance; A, area. Scale bar, 1 mm. C, Histograms showing the LY spreading for each case. D shows a representative recording of the intercostal muscles EMG integrated activity (top trace) and the corresponding arterial SaO2 monitored using the non-invasive MouseOx system during AIH. Note that the arterial SaO2 drops between 30 and 40% at the end of an isocapnic hypoxic bout (see Materials and Methods).
