Figure 7.
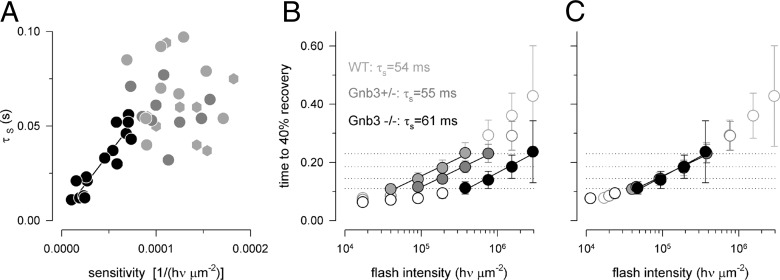
Saturating responses in Gnb3+/− and Gnb3−/− cones recover with normal kinetics, and the same response durations as in WT are achieved with brighter intensities. A, Recovery time constant measured in the intensity range ∼105–106 photons per μm2 (as in Fig. 5) for all cones in the current study versus light sensitivity (filled light gray circles for WT, filled dark gray circles for Gnb3+/− and filled black circles for Gnb3−/− cones). WT M-dominant cone data from the study of Nikonov et al., 2006 (light gray hexagons) are also added for comparison. A linear regression line was fitted to the Gnb3−/− data points, with a correlation coefficient of 0.85. Data taken from WT and Gnb3+/− were not correlated. B, Time to 40% recovery versus flash intensity for each genotype. The data measured from saturating responses used for the “Pepperberg” analysis is plotted with filled circles. The dimmest flash used for the analysis is estimated as 99% saturating for the WT and 100% saturating for the Gnb3+/− and Gnb3−/− cones. The slopes of the straight lines give values of recovery time constant τs as indicated on the figure. The dotted horizontal lines show that responses of the Gnb3+/− and Gnb3−/− cones have similar durations to those of WT but at 2× and 8× brighter flash intensities. C, All data fall on the same trajectory after shifting Gnb3+/− and Gnb3−/− graphs from B to the left on the intensity axis (by 2× and 8× correspondingly). Error bars are ±2 SEMs.

