Figure 9.
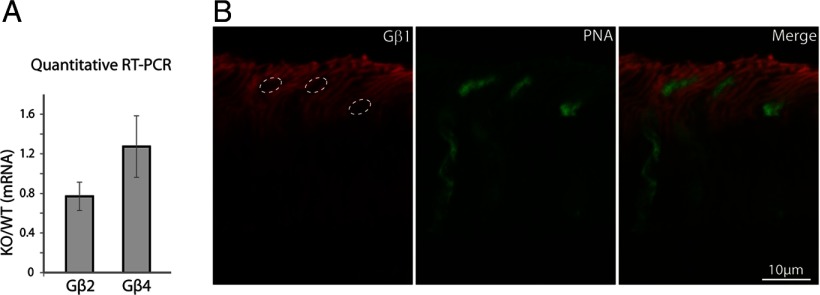
No compensatory expression of other β subunits in the Gnb3−/− retina. A, Bar chart showing quantitative RT-PCR results for the expression levels of Gβ2 and Gβ4 transcripts for Gnb3−/− normalized to WT levels. No upregulation of these transcripts is seen in the null retina. B, Double staining of Gnb3−/− null retina for Gβ1 (red, left), and PNA (green, middle), showing no staining of Gβ1 in cones. Dashed ovals in the left panel show the positions of cones which are devoid of any Gβ1 stain.

