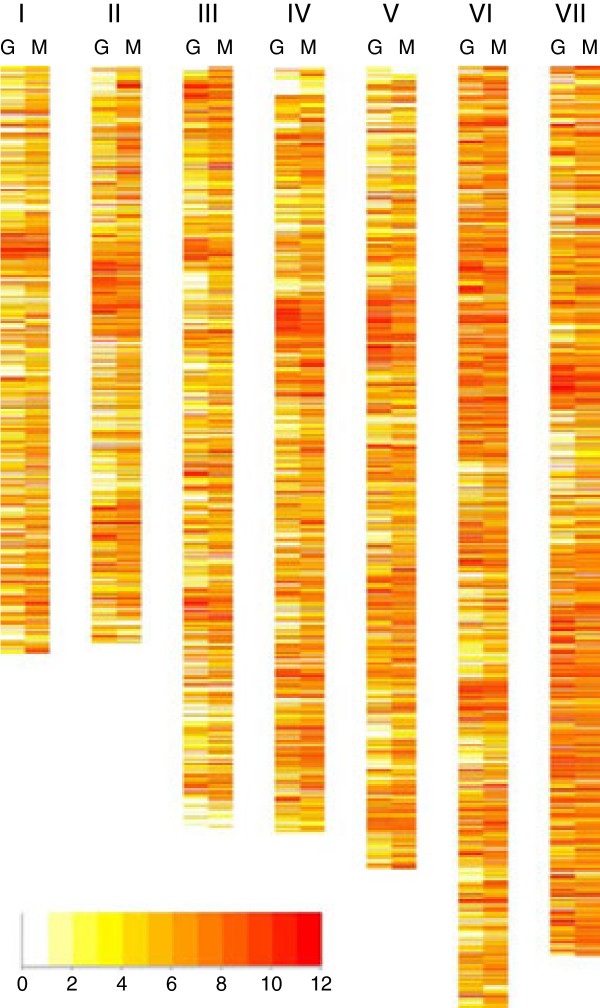
Figure 3.
Transcriptional landscape of the H. polymorpha genome. Heat map showing chromosomal distribution of transcribed genes coloured according to expression levels (log2 tag count). G – glucose grown cells, M - methanol-grown cells. The colour code for normalized log2 transcript count is shown in the bar below.

