
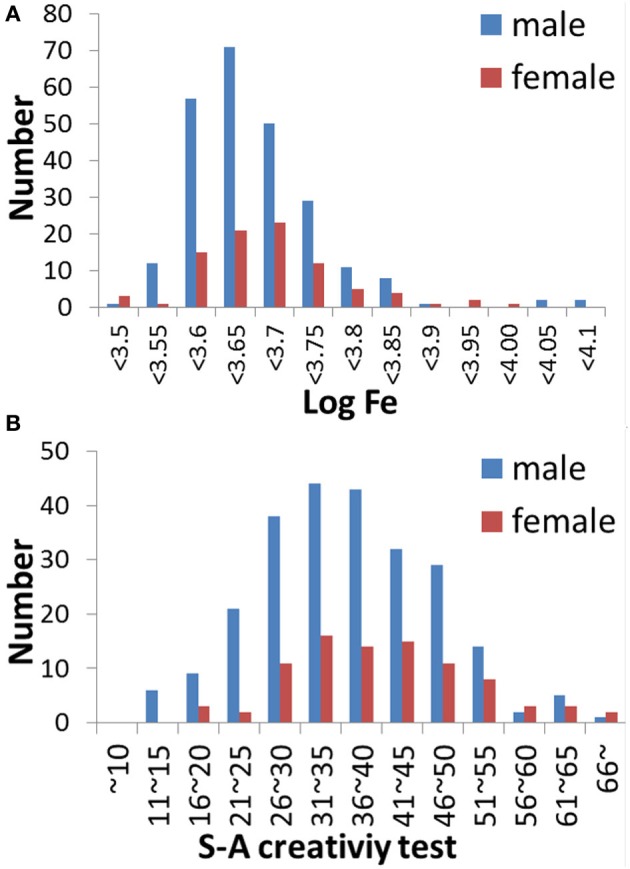
Figure 1.
Histograms of the variables. (A) A histogram showing the logarithms of hair iron levels for male and female subjects. (B) A histogram showing S-A creativity test scores for male and female subjects.
Official websites use .gov
A
.gov website belongs to an official
government organization in the United States.
Secure .gov websites use HTTPS
A lock (
) or https:// means you've safely
connected to the .gov website. Share sensitive
information only on official, secure websites.
Histograms of the variables. (A) A histogram showing the logarithms of hair iron levels for male and female subjects. (B) A histogram showing S-A creativity test scores for male and female subjects.